We have developed team collaboration metrics based on the comment history of Jira tickets. It helps us identify people who are not collaborating well on Jira. It also helps us spot imbalances in teams (e.g.: person X is talking ONLY to person Y, or that person Z is really working well with everyone!).
Note: This post is written in continuation with the post on using Python to analyze Jira.
Background
As an organization that supports remote work and flex-timings, we rely on good written communication to remain effective. We expect our team members to follow certain activities regularly like the ones listed below
- Report the Jira tickets with all the required information
- Write comments/questions on Jira for the tickets being worked upon
- Tag associated team members on the Jira tickets
- Reply to questions/comments on other team member’s Jira tickets
- Share required and relevant information on other’s Jira tickets
How do we identify people who are not collaborating well on Jira tickets?
Over time, we have noticed some problems crop up time and again when someone is not collaborating well on Jira. Here are some examples of problems:
- A person ‘xyz’ is replying only to certain users tickets and ignoring others
- A person ‘xyz’ is tagged on tickets for clarifications and they were not answered
- A person ‘xyz’ is totally ignorant and does not comment at all on Jira tickets
The user collaboration metrics based on Jira tickets comment history will help us to identify such problems.
Example user collaboration metrics graph
We use a heat map to show how well team members exchange information on Jira. Here is an extreme example of how one of our teams was performing. On the X and Y axes, we list the team members. Each cell (x,y) is a shade of green which represents how strongly individuals x,y collaborated over Jira for a given timeframe. The greener a cell, the stronger the bond between the two employees.
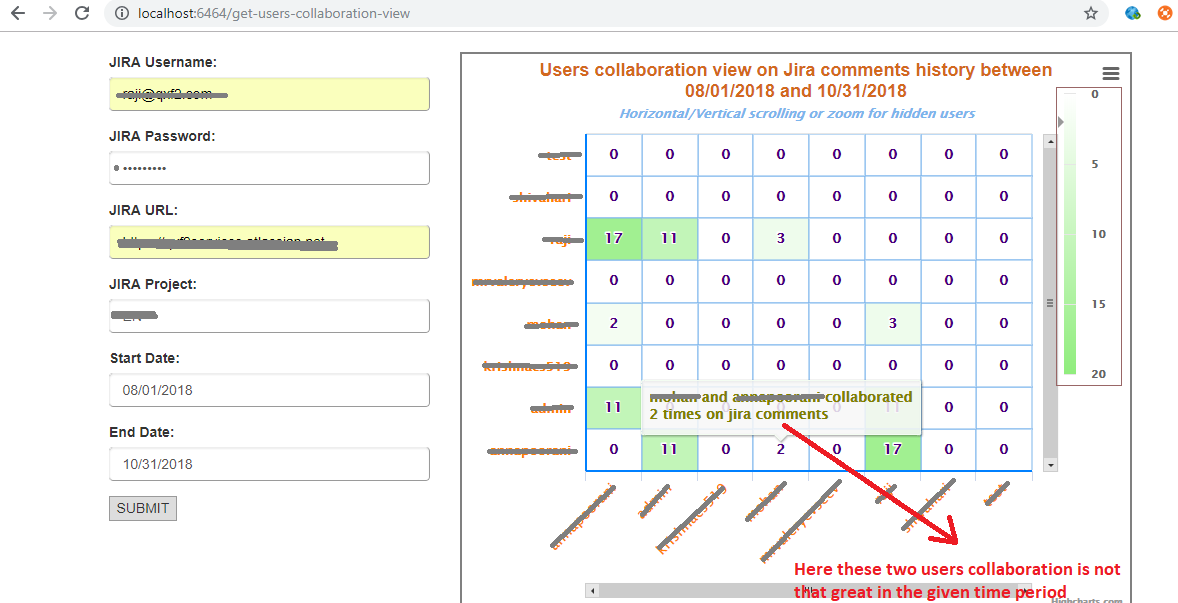
Even a quick glance at this chart will tell you that we had 8 members and just two strong connections!
User collaboration metrics: technical details
In a previous post, we showed you how to use Python to analyze Jira data. We will build upon that work. To follow along, you need to know we developed two important modules:
a) ConnectJira which contains wrappers for many Jira API calls. The sample code is here
b) JiraDatastore which saves individual ticket information as a pickled file. The sample code is here
In this post, we will talk about a backend module called ‘CollaborationMetrics.py’ that helped us create the graph above. As you see in the above screenshot, inputs for this metric are Jira URL, authentication details, start date, and end date.
How did we logically break it down?
Here is how we went about creating the CollaborationMetrics module.
1. Get Jira project users list
project_users_list=self.connect_jira_obj.jira_obj.search_assignable_users_for_issues(username="",project=self.project) |
2. Get all possible ordered user pairs
for pair in itertools.combinations(project_users_list,2): ordered_user_pairs.append(pair) |
3. Get jira ticket list for the given start and end dates
query="project ='%s' AND updatedDate >= '%s' AND createdDate <= '%s' ORDER BY updated DESC" % (self.connect_jira_obj.project, start, end) jira_ticket_list = self.connect_jira_obj.execute_query(query=query) |
4.Get all the users associated with each ticket by parsing through each ticket changelog , fields and comment history
#reporter of the ticket reporter = ticket_fields.get('reporter',None) if reporter is not None: users_list.append(reporter['name']) #Assignees of the ticket if ticket_change_log is not None:#Add all assignees to users list for action in ticket_change_log['histories']: for item in action['items']: if item['field'] == 'assignee' and item['toString'] is not None: users_list.append(item['to']) #commenters of the ticket for comment in ticket_comments_list: users_list.append(comment['author']['name']) |
5.Check if each order pair is found in the ticket associated users list, then increment scoring everytime to each order pair that is found in each ticket associated users list
for pair in ordered_user_pairs: for ticket_associates in tickets_assocites: if pair[0] in ticket_associates[1] and pair[1] in ticket_associates[1]: ordered_user_pairs_obj[pair] = ordered_user_pairs_obj[pair]+1 #increment the score collaboration_scoring = ordered_user_pairs_obj |
7. Format collaboration metrics series output data
![]()
![]()
8. Added GET api call to render the collaboration metrics front end template
if request.method == 'GET': return render_template('get-users-collaboration-view.html', title='Users collaborative data') |
9. Added POST api call to interact with the backend for the data processing and format the backend data as per the high chart heap map configuration requirement
if request.method == 'POST': "format the data for the heat map input" try: users_with_index = dict((item,index) for index,item in enumerate(users_list)) collaboration_data = [] for key,val in collaboration_metrics.items(): collaboration_data.append([users_with_index[key[0]],users_with_index[key[1]],val]) collaboration_data.append([users_with_index[key[1]],users_with_index[key[0]],val]) #add zero collaboration with the same user collaboration_with_the_same_user = [[index,index,0] for index in range(len(users_list))] collaboration_data = collaboration_data+collaboration_with_the_same_user max_no_of_comments = max(map(lambda item:item[2],collaboration_data)) except Exception as error: error = error api_response = {'collaboration_data':collaboration_data,'users_list':users_list, 'max_no_of_comments':max_no_of_comments,'error':error} return jsonify(api_response) |
10. We have used High charts JS library to generate heat map for the jira users collaboration data
src="https://code.highcharts.com/highcharts.js" src="https://code.highcharts.com/modules/heatmap.js" |
NOTE: While Qxf2 has the habit of open sourcing many of our R&D projects, we will not be open sourcing this code in the near future.
I have around 10 years of experience in QA , working at USA for about 3 years with different clients directly as onsite coordinator added great experience to my QA career . It was great opportunity to work with reputed clients like E*Trade financial services , Bank of Newyork Mellon , Key Bank , Thomson Reuters & Pascal metrics.
Besides to experience in functional/automation/performance/API & Database testing with good understanding on QA tools, process and methodologies, working as a QA helped me gaining domain experience in trading , banking & investments and health care.
My prior experience is with large companies like cognizant & HCL as a QA lead. I’m glad chose to work for start up because of learning curve ,flat structure that gives freedom to closely work with higher level management and an opportunity to see higher level management thinking patterns and work culture .
My strengths are analysis, have keen eye for attention to details & very fast learner . On a personal note my hobbies are listening to music , organic farming and taking care of cats & dogs.