We have developed a time view of statuses metrics based on Jira data as part of our engineering benchmarks application
Note: This post is written in continuation with the other blog on the engineering metrics.
What is time view of statuses metrics?
It is the time view graph that shows how many tickets were present in a given set of statuses for each day of a time period. The graph serves as an excellent tool to help with your hiring estimates. It also helps you identify when new hires start hitting their stride.
Background
We wanted to develop this graph because we did not find an easy way to look at a time view of statuses of tickets on Jira tool. As QA, we sense our workload increase but it is hard to make a case for more QA engineers with just a count of tickets. The metric described in this post also helps us to understand workload on daily basis.
This is an example of the time view of statuses graph. The x-axis shows dates and the y-axis shows the number of tickets. The three lines plotted correspond to the statuses “in progress”, “feature test” and “peer review”.
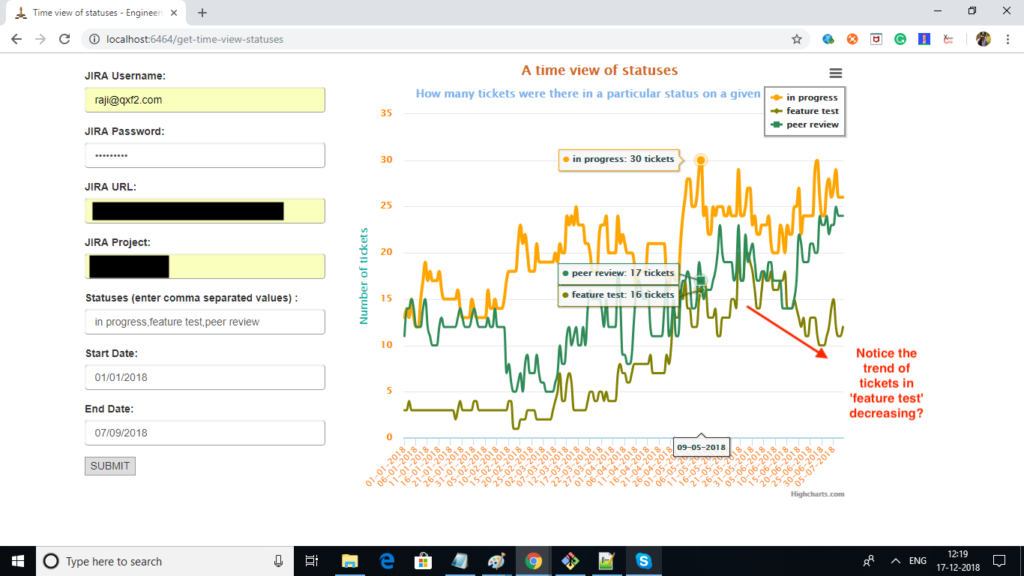
The chart above shows us three statuses over the first seven months of this year at one of Qxf2’s clients. Around May, we realized that the QA load over the last couple of months had been increasing steadily. We requested and got a new QA engineer joining us at the end of May. You can see the immediate impact she had – the number of tickets in the status ‘feature test’ started to trend downwards. Now, we are not only in a position to show this sort of impact but we can also alert our engineering management to other potential problems like the ballooning number of tickets in peer review.
A time view of statuses metrics technical details
In a previous post, we showed you how to use Python to analyze Jira data. We will build upon that work. To follow along, you need to know we developed two important modules:
a) ConnectJira which contains wrappers for many Jira API calls. The sample code is here
b) JiraDatastore which saves individual ticket information as a pickled file. The sample code is here
We have also developed a backend module called ‘TimeViewStatuses.py’. As you see in the above screenshot, inputs for this metrics are Jira URL, authentication details, start date, and end date
How did we logically break it down?
1. Get tickets that are present in the given timeframe
jql_result = self.connect_jira_obj.execute_query(query="'project'='%s' AND createdDate <= '%s' ORDER BY updated DESC" % (self.connect_jira_obj.project, end_date)) |
2. Collect all possible statuses for all tickets and their start and end dates
def get_ticket_status_dates(self, ticket_key): "Get ticket all statuses and their start date and end date" # This method returns a list of lists [[status1,start1,end1][status2,start2,end2]] status_dates,status_journey,error = [],[], None ticket = self.get_individual_tickets(ticket_key) ticket_changelog = self.datastore_obj.get_item_in_json_ticket(ticket['ticket_in_json'],'changelog') #order the ticket change log histories in descending order ticket_changelog_histories = ConnectJira.order_list_of_dicts(ticket_changelog['histories'],'id','desc') ticket_fields = self.datastore_obj.get_item_in_json_ticket(ticket['ticket_in_json'],'fields') try: ticket_creation_date = arrow.get(ticket_fields['created']) current_status = str(ticket_fields['status']['name']).lower() for action in ticket_changelog_histories: for item in action['items']: if item['field'] == 'status': status_journey.append( [item['toString'].lower(), arrow.get(action['created'])]) status_journey.append( [item['fromString'].lower(), arrow.get(action['created'])]) if len(status_journey) > 0: #For tickets created but never worked on, status_journey can be empty status_journey.append([status_journey[-1][0], ticket_creation_date]) status_journey.reverse() # We'll end on the current status and add now() as the end date status_journey.append([current_status, arrow.now()]) for i in range(0,len(status_journey)-1): if status_journey[i][1] != status_journey[i+1][1]: status_dates.append([status_journey[i][0],status_journey[i][1],status_journey[i+1][1]]) except Exception as error: print error.message, ticket_key error = error.message + " " + ticket_key + " " + str(len(status_journey)) return {'status_dates':status_dates, 'error': error} |
3. Loop through each date and see how many tickets were present per status
def count_tickets_per_date(self, startdate, enddate, status_start_end, statuses_list): "Return a count of tickets per day in each status for a date range" start, end = arrow.get(startdate), arrow.get(enddate) date_series, status_series, status_done = [], {}, {} for status in statuses_list: status_series[status] = [] #Iterate through all dates provided by the user and have a count for date in arrow.Arrow.range('day',start,end): date_series.append(date.format('DD-MM-YYYYYYY')) for status in statuses_list: status_series[status].append(0) for ticket_status_journey in status_start_end: for status in statuses_list: status_done[status] = False for val in ticket_status_journey: #val is of the format [status_name, startdate, enddate, ticket_key] if val[1].floor('day') <= date <= val[2].ceil('day'): if status_series.has_key(val[0]) and not status_done[val[0]]: status_series[val[0]][-1] += 1 status_done[val[0]] = True print date.format('DD-MM-YYYYYYY'), val[0], val[3] time_view_statuses = {'dates':date_series,'status_series':status_series} return time_view_statuses |
4. Added GET api call to render the time view of statuses metrics front end template
if request.method == 'GET': return render_template('/get-time-view-statuses.html', title='Time view of statuses') |
5. Added POST api call to interact with the backend for the data processing and format the backend data as per the high chart heap map configuration requirement
if request.method == 'POST': #required jira logic calls for the given form input status_list = split_str_to_list(statuses, ',') jira_obj = TimeViewStatuses(jira_url, username, password, project) backend_result = jira_obj.get_time_view_statuses(status_list, start_date, end_date) error = backend_result['error'] data = [] if error is None: for k,v in backend_result['time_view_statuses']['status_series'].iteritems(): data.append({'name':k,'data':v}) api_response = {'dates': backend_result['time_view_statuses']['dates'], 'data': data,'error': error} else: api_response = {'dates': [], 'data': [],'error': error} return jsonify(api_response) |
6. We have used High charts JS library to generate column chart for the jira sprint/bucket metrics
src="https://code.highcharts.com/highcharts.js" src="https://code.highcharts.com/modules/heatmap.js" |
NOTE: While Qxf2 has the habit of open sourcing many of our R&D projects, we will not be open sourcing this code in the near future.
I have around 10 years of experience in QA , working at USA for about 3 years with different clients directly as onsite coordinator added great experience to my QA career . It was great opportunity to work with reputed clients like E*Trade financial services , Bank of Newyork Mellon , Key Bank , Thomson Reuters & Pascal metrics.
Besides to experience in functional/automation/performance/API & Database testing with good understanding on QA tools, process and methodologies, working as a QA helped me gaining domain experience in trading , banking & investments and health care.
My prior experience is with large companies like cognizant & HCL as a QA lead. I’m glad chose to work for start up because of learning curve ,flat structure that gives freedom to closely work with higher level management and an opportunity to see higher level management thinking patterns and work culture .
My strengths are analysis, have keen eye for attention to details & very fast learner . On a personal note my hobbies are listening to music , organic farming and taking care of cats & dogs.