As a tester, we work with applications deployed on Kubernetes. That means, we need to know how to interact with various components of Kubernetes. But most online tutorials start with stuff that applies mostly to developers and DevOps engineers like install, writing deploy scripts, etc. Those are not really useful to testers, at least not directly. So, in this blog, I have tried to cover most of the components of Kubernetes that testers need to know and explore. To gain practical hands-on experience, you can deploy our Todo list app, which is available here, on Kubernetes platforms like Minikube, Kind, or any cloud platform such as EKS, AKS, GKS. At Qxf2, we deployed the Todo list app on Minikube and captured screenshots for this blog. You can also try it with your own app.
Check Nodes:
“Nodes” in Kubernetes are the individual worker machines that make up a cluster. They are responsible for running containers, hosting Pods, and executing the workloads managed by the Kubernetes control plane. Nodes provide the computing and networking resources needed to run applications.
Use the following command to check all Nodes:
kubectl get nodes |
This command provides all available nodes along with their status, roles, age, and version. Look at the screenshot below.

To get more details about nodes, you can use the following command:
kubectl get nodes -o wide |
The above command provides additional information about internal IP address, external IP address, OS image, Kernel version, and readiness container runtime. Look at the screenshot below.

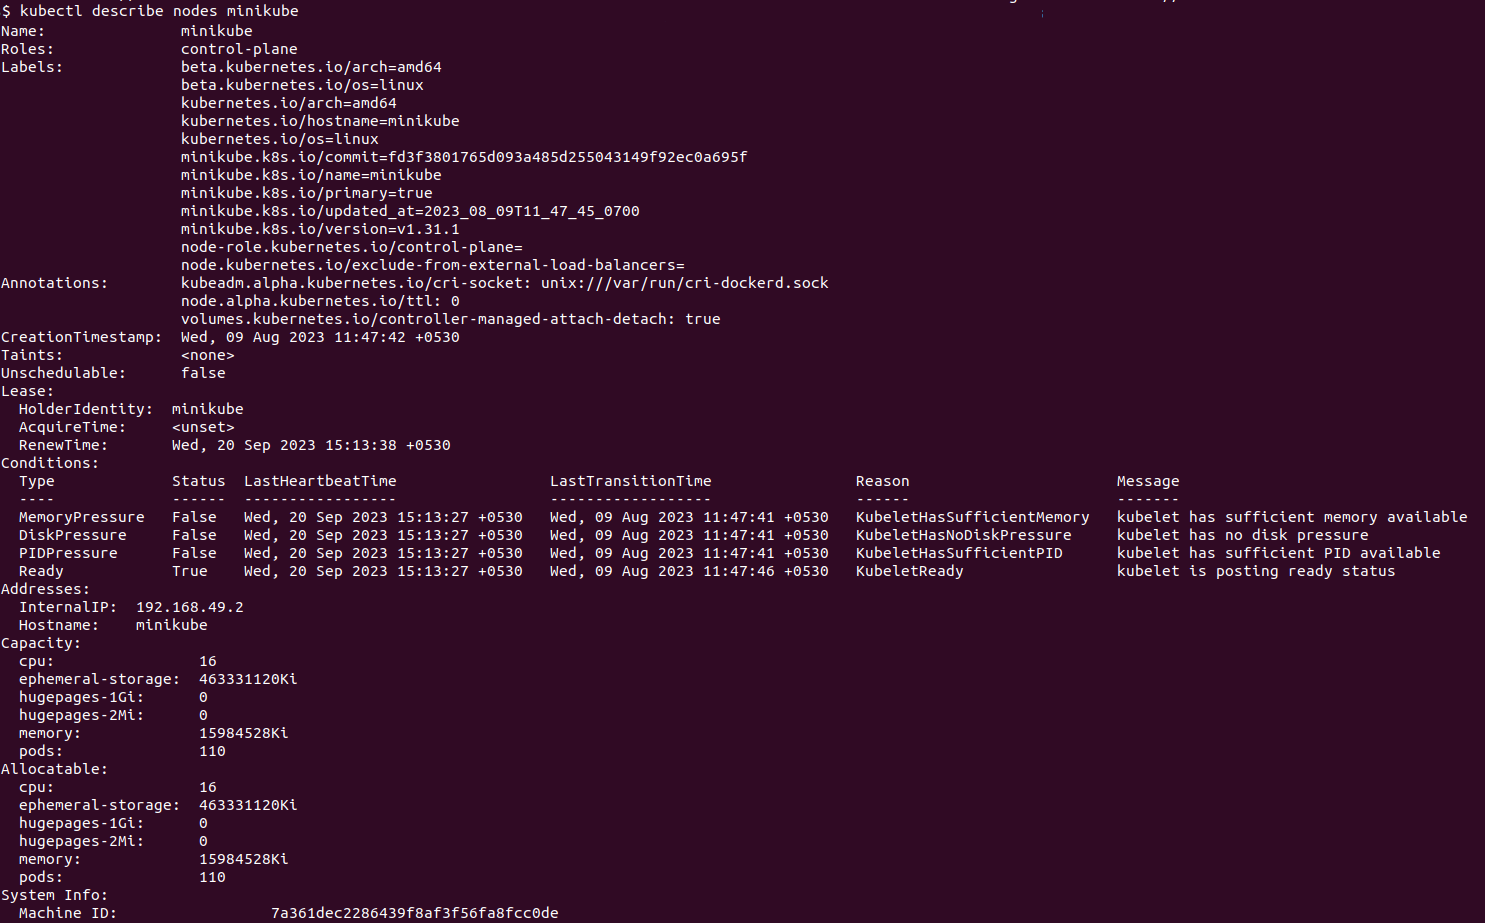
To see even more details of any node, you can use the following command. It will provide all information about a specific node. Look at the screenshot below.
Check Pods:
In Kubernetes, a “Pod” is the smallest deployable unit that can hold one or multiple containers. Pods are the basic building blocks of applications in a Kubernetes cluster. Containers within a Pod share the same network namespace, which means they can communicate with each other using localhost, and they can also share storage volumes.
Use the following command to check all Pods:
kubectl get pods |
This command provides all available pod names along with their status, readiness, how many times they have restarted, and age. You can check the status, readiness, and the number of restarts to decide if there is any problem with the pod. Look at the screenshot below.

If you want even more details about pods, you can use the following command:
kubectl get pods -o wide |
The above command provides additional information such as IP address, the node where the pod is deployed, the nominated node, and readiness gates. Refer to the screenshot below.

Usually, the pod’s status, readiness, and restart fields help to find problems with the pods. If you notice a problem with a pod or you want to see more details, you can use the following command:
kubectl describe <pod name> |
The above command provides complete details about the pod, including its namespace, status, IPs, container details, volumes, node selectors, conditions, events, etc. Refer to the screenshot below.

Check deployments:
In Kubernetes, a “Deployment” is a resource that defines and manages the desired state of a set of Pods. Deployments ensure that a specified number of replica Pods are running at all times, and they can handle updates and rollbacks of application versions. Deployments are a key component for managing and scaling applications in Kubernetes.
Use the command below to list the available deploy resources in Kubernetes.
kubectl get deploy |
The above command lists out all deploy names along with their readiness, availability, update status, and age. Look at the screenshot below:

If you want to see more details like containers and images, you can run the command along with the “-o wide” option.
kubectl get deploy -o wide |
Now it provides additional container, image, and selector details used for deployment.

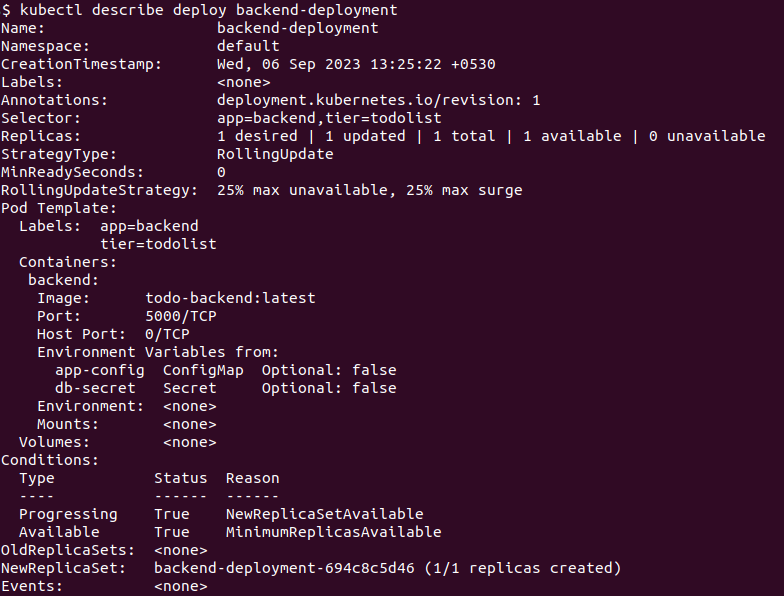
If you want to check even further details, you can use the “describe” command:
kubectl describe deploy <deploy_name> |
Look at the below screenshot.
Check StatefulSet:
A “StatefulSet” is a Kubernetes resource used for managing stateful applications, such as databases, where each pod has a stable and unique identity. It ensures ordered, stable deployment and scaling of Pods, making it suitable for applications that require persistent network identifiers and storage.
Use the command below to list the available StatefulSet resources in Kubernetes.
kubectl get statefulset |
The above command lists all the StatefulSet names along with their readiness and age. Please refer to the screenshot below. 
If you want to see more details, such as containers and images, you can run the command with the “-o wide” option.
kubectl get statefulset -o wide |
Now it provides additional information about containers and images used.

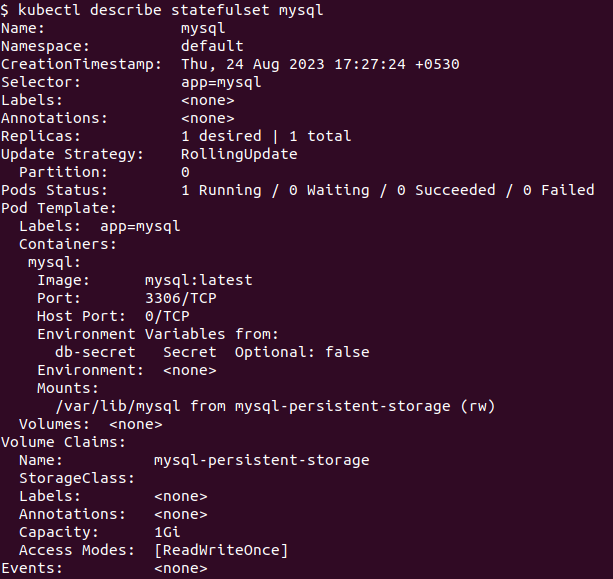
If you want to check even further details, you can use the “describe” command:
kubectl describe statefulset <StatefulSet_name> |
Please refer to the screenshot below.
Check Replicaset:
A “ReplicaSet” is a Kubernetes resource used for ensuring a specified number of replica Pods are running at all times. It helps maintain the desired number of identical Pods, making it useful for achieving high availability and load balancing in Kubernetes.
Use the following command to list out the replica sets:
kubectl get rs |
The above command provides a list of available replica sets along with desired, current, and ready state details. Please refer to the screenshot below:

You can run the above command with the “-o wide” option to get container, image, and selector details.

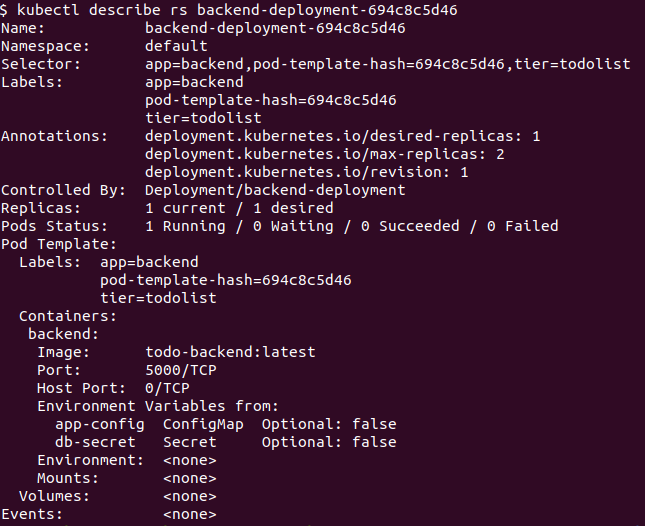
If you want to know more details, you can use the following describe command:
kubectl describe rs <replica set name> |
Please refer to the screenshot below.
Check Service:
A “Service” in Kubernetes is a resource that defines a stable network endpoint for accessing a set of Pods. It enables load balancing, service discovery, and abstracts the network details, allowing other Pods to access a set of Pods using a single, consistent hostname or IP address.
To check the list of all available services, use the following command:
kubectl get svc |
This command lists all available services along with their type, cluster IP, external IP, port, and age. Look at the screenshot below.

You can use the “-o wide” option to get selector details.

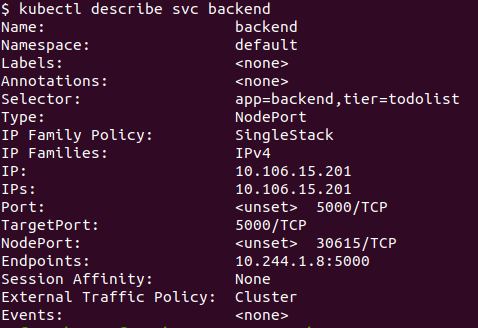
If you want to know more details about a service, you can use the “describe” command for that specific service:
kubectl describe svc <service name> |
Please refer to the screenshot below.
Check ConfigMap:
A “ConfigMap” in Kubernetes is a resource for storing configuration data as key-value pairs or as plain text in a centralized and reusable manner. It allows you to decouple configuration from application code, making it easier to manage and update configuration settings for Pods and other resources in the cluster.
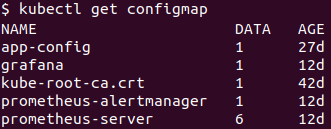
To check the list of all ConfigMaps, use the following command:
kubectl get configmap |
This command lists all available ConfigMaps along with the number of data it consists of. Please refer to the screenshot below.
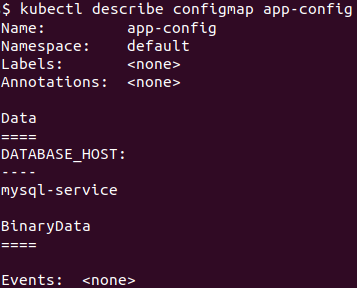
If you want to know more details about a ConfigMap, you can use the “describe” command:
kubectl describe configmap <configmap name> |
Please refer to the screenshot below for ConfigMap details.
Check Secrets:
A “Secret” in Kubernetes is a resource for storing sensitive data, such as API keys, passwords, or certificates, securely within the cluster. Secrets are base64-encoded and can be mounted into Pods as files or exposed as environment variables, providing a way to manage and access sensitive information in a more secure manner.
To check the list of all secrets, use the command below:
kubectl get secrets |
This command lists all available secrets along with the number of data it consists of. Look at the screenshot below.

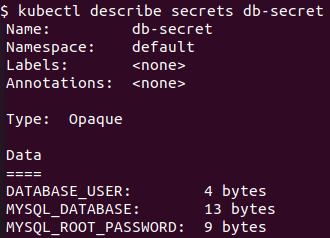
If you want to know more details about secrets, you can use the “describe” command:
kubectl describe secrets <secrets name> |
Look at the screenshot below; it shows secret keys along with their value sizes.
Check Ingress:
“Ingress” in Kubernetes is a resource that manages external access to services within the cluster. It acts as an API gateway and load balancer, routing incoming HTTP and HTTPS traffic to specific services based on rules defined in the Ingress resource.
To check the list of all Ingress, use the following command:
kubectl get ingress |
This command lists all available Ingress along with hosts and addresses. Look at the screenshot below.

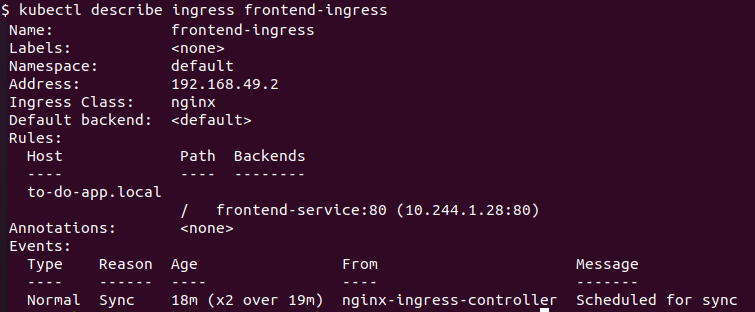
If you want to know more details about Ingress, you can use the “describe” command:
kubectl describe ingress <ingress name> |
Look at the screenshot below; it shows additional information about the Ingress class, rules, etc.
Check Egress:
In Kubernetes, “egress” refers to the network traffic that originates from within a Kubernetes cluster and is destined for resources outside of the cluster. Egress traffic typically includes requests made by pods to external services, APIs, databases, or the internet as a whole.
You can check Egress policies using the following command:
kubectl get networkpolicy |
Note: No egress policy is set in our example available here, so no screenshot is provided.
How to check logs:
If your application generates logs, then you can view them using the following command:
kubectl logs <pod name> |
Please refer to the screenshot below.

How to enter inside the containers:
For further debugging, sometimes we need to enter a pod or run a specific command. To do that, use the following command:
kubectl exec -it <podname> -- <command> |
To enter the container and investigate its contents, you can use /bin/bash or /sh depending on the container’s design:
kubectl exec -it <podname> -- /bin/bash |
Please refer to the screenshot below.

How to check if ConfigMap or Secrets have been applied correctly or not:
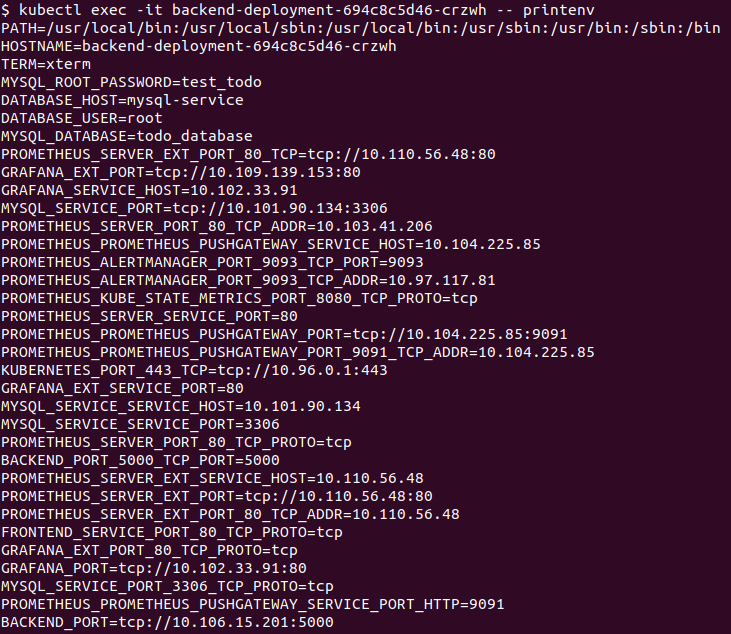
To verify whether ConfigMaps or Secrets have been applied correctly to a pod, you need to run the “printenv” command on the respective pod and check if your ConfigMaps or Secrets were set correctly or not. Please refer to the screenshot below.
We hope our blog is helpful for you in investigating your Kubernetes cluster.
Hire technical testers from Qxf2
Hire Qxf2’s technical testers for in-depth testing expertise that uncovers critical software issues, elevating your project’s quality and reliability. With diverse technical skills, we dive deep to deliver robust testing solutions. Contact us.

I love technology and learning new things. I explore both hardware and software. I am passionate about robotics and embedded systems which motivate me to develop my software and hardware skills. I have good knowledge of Python, Selenium, Arduino, C and hardware design. I have developed several robots and participated in robotics competitions. I am constantly exploring new test ideas and test tools for software and hardware. At Qxf2, I am working on developing hardware tools for automated tests ala Tapster. Incidentally, I created Qxf2’s first robot. Besides testing, I like playing cricket, badminton and developing embedded gadget for fun.
