In general, when we have some performance problem with our code, profilers can be used to help identify where the problem actually lies. It can be used to check how long the functions defined in your code took to execute, how many times a particular function is being called etc. We were able to use cProfile to find out some useful information about our tests. In case you want to get some additional information about your test with some minor code changes you should find this blog useful.
What is the need for cProfile in testing?
We always wanted to check how many times some tests function were getting called in our GUI tests. Also in case, we end up having multiple exceptions it made sense to see how many times which exceptions were getting called. cProfile is one of the popular python based profiling tool. When we used cProfile we got some useful ideas which we could implement on our python-based testing framework. We decided to pen down the same in this post. You can try using cProfile with your own tests and framework based on your use-case.
Some of the below stats related to what functions are getting called, how many times and how long a function call takes were useful for our case.
- ncalls – how many times the function/method has been called
- tottime – the total time in seconds excluding the time of other functions/methods
- percall – average time to execute function (per call)
- cumtime – the total time in seconds includes the times of other functions it calls
- percall – similar to the previous percall, however this one includes network delays,sleep
How to use cProfile
We will use cProfile to get some useful stats for our GUI tests which is built based on Python Selenium Page Object Model Framework.. cProfile is included in Python’s standard library.
Coding changes in Python Framework for profiling:
To add profiling to your code you just need 5 to 6 lines of additional code. We need to import cProfile first, then create a profile object, enable it, disable it after the function we want to profile has been called and save the stats to a file. You can look at the example below.
import cProfile, pstats pr = cProfile.Profile() pr.enable() test_example_form()---your code pr.disable() ps = pstats.Stats(pr).print_stats() |
Statistics to know how many time a particular function has been called
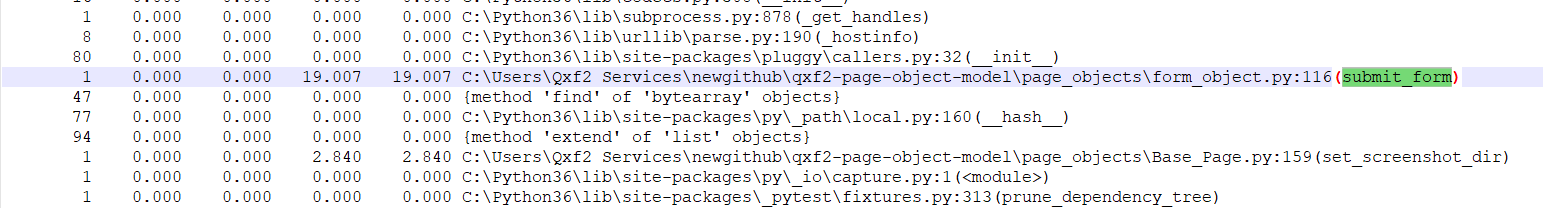
In our Qxf2 based framework test, there is a test case named test_successive_form_creation. We are trying to fill in details like name, phone, email, etc and then submit the form multiple times. In case we need to get details on how many times the form was submitted we can get the details using the above code. You may need to filter out the function names. Under statistics we have the last column named as “filename:lineno(function)”, we can filter out the required function name by a search.
Looking at the statistics to know how many times Exception has been caught
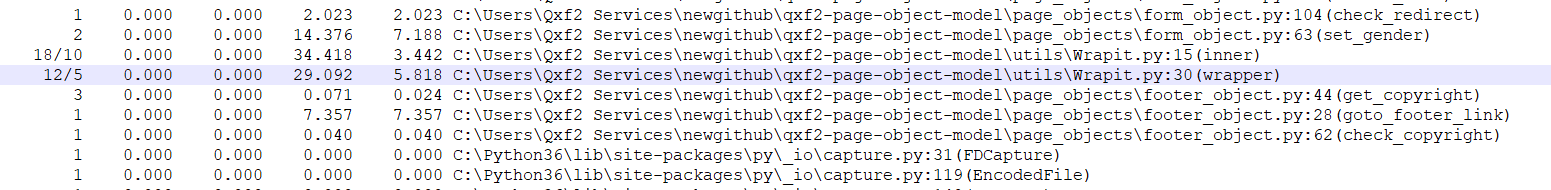
With cProfile statistics, we can track the Exceptions too. However, in Our framework, we have some wrapper(Wrapit.py), containing Exception Handlers so we can’t exactly see the exception. The Exception handler decorator is used to capture exceptions. This decorator is used, when an error occurs to prevents tests from stopping. If we want to check how many times exception handler in Wrapit.py got called, we can test the test_example_form with some missing info. Since our framework uses a testrail util to submit test results to testrail, we will try to report test results without passing testrail id. Now we can check the cprofile statistics to get this information as shown below:
Also in case you want to reuse the statistics from the file, you may want to save it to a readable file and reuse it. For more details of how to save the statistics in a csvfile, you can refer to our blog.
Using cprofilev as a wrapper on command line:
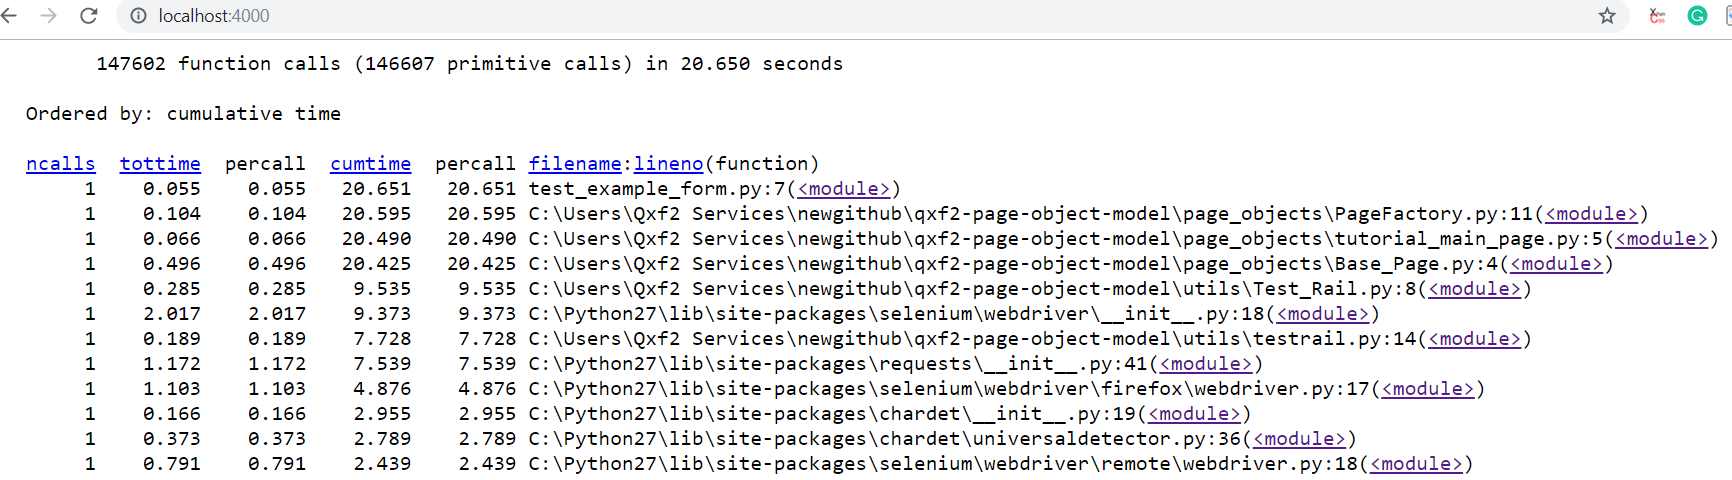
We also found some cool tool to visually view the cProfile stats better. cprofilev is a simple way of profiling your Python program. When you run python code with cprofilev from the command line, it gives you output on html page running on http://localhost:4000. When you run your code, it opens up 4000 port for profile statistics. User can view the same on that port. The beauty of cprofilev is you can sort the statics, as well as you can view particular function statistics just by clicking on that particular function.
Installation of cprofilev:
pip install cprofilev |
We can run our code with cprofilev as below:
python -m cprofilev test_example_form.py |
Hope you find this article useful!!
I have started my career with Networking Domain.Have 8 years of relevant IT experience in network protocol testing.Experienced in functional testing of various networking protocols and Device-specific features.I was involved mainly in Manual Testing, Writing Test Plans, Updating Release Notes, Documentation for the same.Mainly worked on L4-L7 Load Balancers, Application Accelerators, Application Delivery Controllers.After that, I was looking for Automation Testing and Remote Work Opportunities.I found Qxf2 is the right place.Learning Python,Automation Framework, Exploring New Tools for Automation.My hobbies are listening classical,non-classical music .