In this post, we outline a cheap and creative way to perform repeatable and controlled tests on the Fitbit heart rate monitor. Our test has a reasonable degree of accuracy. We hope it helps the Fitbit developers rapidly test their prototypes. To be clear: thorough, accurate and precise testing is needed in the later stages of development. The test outlined here is not suitable for later stages of development.
This is the second part in a 2-part series of posts where we outline a quick and dirty tests for testing Fitbit’s heart rate monitor. We strongly suggest you begin by reading the first part of this post. In the first part, we wrote about the working principle of optical heart rate sensors, how we exercised Fitbit heart rate reading with different colored paper, plastic bottles and how we went about testing the Fitbit heart rate detector. In this part, we will cover how we mimicked the heart rate flow, dive into the details of our setup, share the Arduino code to control our stepper motor, provide readings and measurements we took, identify limitations with our approach and finally talk about how we could improve our system.
Setup
We want to be able to mimic the heart rate in a controlled manner. To mimic blood flow rate for Fitbit heart rate monitor testing, we decided to use two different reflected index materials which together mimic a pulse. We used two different colored craft paper to generate heart pulse and placed them on a wheel. We controlled the pulse rate by using a stepper motor to control the speed of the wheel. We developed this heart pulse wheel with different colored paper for 2 or 3 heart pulse per wheel as shown in Fig. 1
Validating the idea
To test Fitbit heart rate monitor system, we need to rotate heart pulse wheel at different speeds to mimic blood flow. We initially choose 12V DC motor for rotating wheel and speed of DC motor controlled with a potentiometer. We observed that at different speeds of the motor, Fitbit shows different readings as shown in following Fig. 2. Fitbit readings are directly proportional to a speed of wheel i.e. speed of moving craft paper strips.
This step was helpful to validate the idea that our concept will work and we can exercise the heart rate monitor over a range of heart rates in a controlled manner.
Note: We observed that the Fitbit readings depended on the distance between heart rate sensor and target. It took us a while, but we fixed the distance between sensor and target by developing a nicely fitting box frame like in Fig 4.
Controlling the speed of the heart pulse wheel
To test the Fitbit heart rate monitoring system against a range of heart rates, we need to control the speed of heart pulse wheel accurately. So we decided to use a stepper motor to control the speed of heart pulse wheel. We programmed an Arduino to control the speed of our stepper motor.
We have used a 6-wire hybrid type stepper motor, an Arduino Uno and L293D motor driver. The stepper motor interfaced with the Arduino Uno using an L293D motor driver in a bipolar fashion. We chose high torque stepper motor as we needed to rotate a wheel of approximate 400 gms. Look at following Fig. 3 for the block diagram.
After interfacing the stepper motor with Arduino Uno, we moved to test stepper motor speed range. From our speed test, we found that the stepper motor works well between 1 to 100 RPM. After 100 RPM it starts missing pulses. We also found that at low and high-speed motor makes heavy noise. So we decided to run stepper motor between 35 to 75 RPM and then used 2 and 3 pulse wheel model. That way we were able to accurately mimic a heart rate of up to 180. Look at following Fig. 4 for the hardware setup.
We used Arduino’s inbuilt ‘Stepper.h’ library to control the stepper motor speed. Below is a code snippet you can use if you are performing this test at home.
/*This is sample code for this blog post. This code does not reflect Qxf2's coding habits*/ #include //Define pin numbers int in1Pin = 12; int in2Pin = 11; int in3Pin = 10; int in4Pin = 9; // change this to the number of steps on your motor #define STEPS 200 Stepper motor(STEPS, in1Pin, in2Pin, in3Pin, in4Pin); void setup() { Serial.begin(9600); //Enable serial monitor/communication Serial.println("Set motor speed (in RPM) : "); // print msg on serial monitor for user while(Serial.available()==0); { } // wait here until user enter input data int user_speed= Serial.parseInt(); // Read entered integer value and store it in a variable Serial.print(user_speed); // print user entered speed on serial monitor motor.setSpeed(user_speed); // Set stepper motor speed to user defined speed } void loop() { motor.step(STEPS); //Run stepper motor } |
The experiment
Once we were done with the hardware setup, we started testing of heart rate monitor system and took readings. Here the expected reading depends on the speed of motor and heart pulse wheel.
If 2 beat heart pulse wheel is used for testing, then the expected reading is as follows:
Expected Reading = 2 * speed of motor
If 3 beat heart pulse wheel is used for testing, then the expected reading is as follows:
Expected Reading = 3 * speed of motor
Test Steps
- Check and note down, you are using 2 or 3 beat heart pulse wheel
- Calculate the speed of stepper motor required based on heart pulse wheel and expected reading. Use above formula to find the speed of stepper motor.
- Set stepper motor speed from Arduino serial monitor as shown in the following fig. 5.
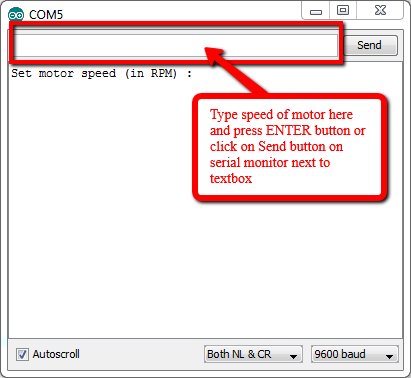

Fig. 5 Arduino Serial Monitor - Once you are done with above step, the stepper motor starts to rotate at defined speed along with heart pulse wheel. Keep your Fitbit above heart pulse wheel and lock the Fitbit belts in frame notches to fix its position.
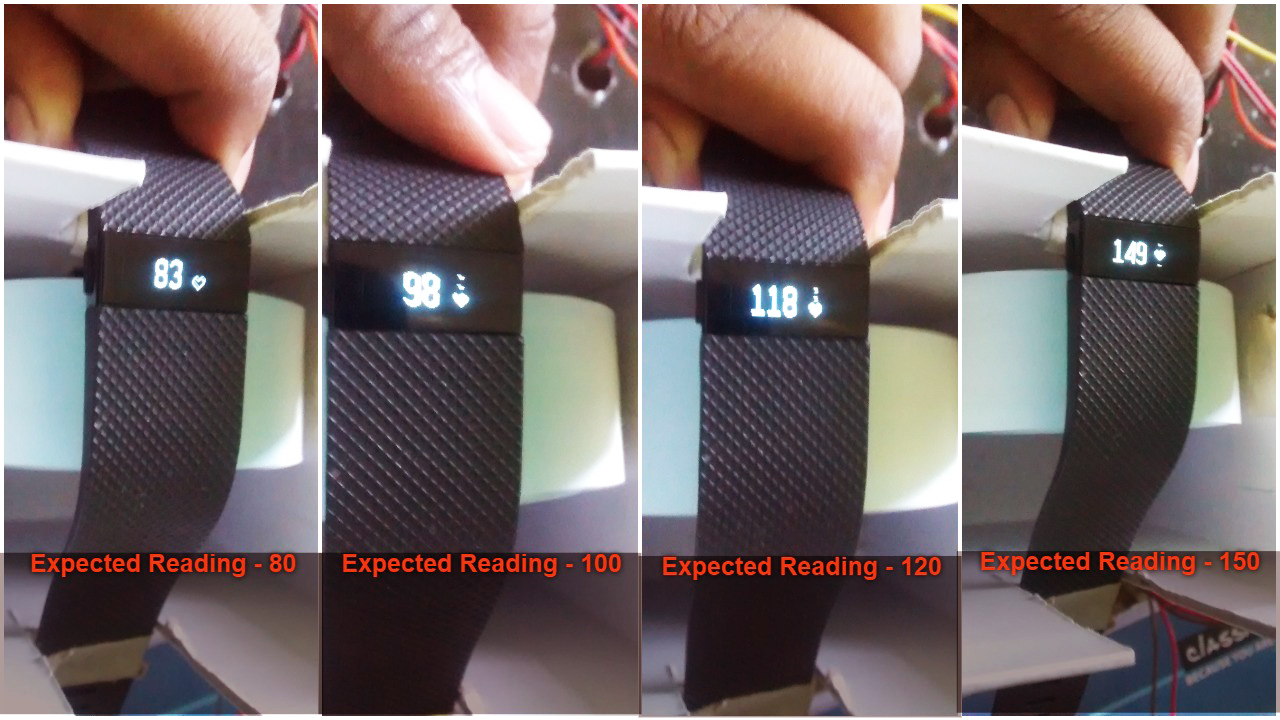
- After some time (say about 30+ sec), Fitbit shows heart beat reading on its display. Note down that reading as the actual reading. Look at following videos for the demo.
- To stop the stepper motor or to change stepper motor speed, press ‘reset’ button on Arduino board. Look at following video 1 for the demo of testing.
Video. 1 Fitbit heart rate monitoring system testing demo
Disappointing results …
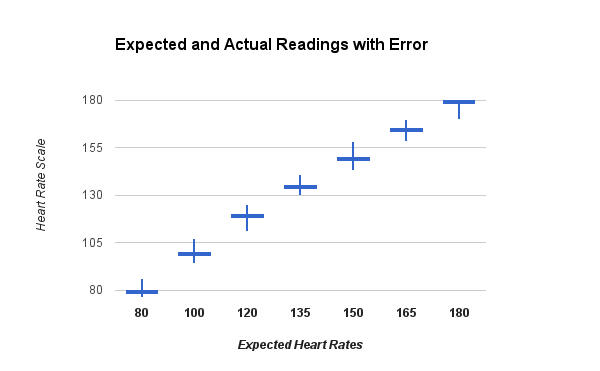
We repeated the test 10 times for each expected readings and took notes of expected and actual reading as shown in Table 1. We collected and analyzed the data and plotted a candlestick chart as shown in Fig. 6. We were highly disappointed with the margin of error.
Formulae used for Calculations:
1.Error:
Error = Actual Heart Rate – Expected Heart Rate
2.Error in %:
Error in % = (Error/Expected heart rate) * 100
| Table 1. Results when Fitbit is kept in parallel with heart pulse wheel | |||
| Expected heart rate | Actual heart rate readings | Error range | Error range (%) |
| 80 | 85, 77, 82, 75, 81, 86, 80, 79, 88, 76 | -5 to +8 | -6 to +10% |
| 90 | 84, 90, 95, 96, 91, 88, 90, 86, 90, 93 | -6 to +6 | -7 to +7 % |
| 100 | 95, 98, 97, 94, 105, 101, 100, 96, 107, 104 | -6 to +5 | -6 to +5 % |
| 120 | 111, 118, 122, 125, 123, 117, 115, 120, 119 | -9 to +5 | -8 to +7 % |
| 135 | 132, 138, 140, 135, 139, 141, 131, 130, 135 | -5 to +6 | -4 to +4 % |
| 150 | 143, 148, 152, 150, 154, 155, 155, 158, 146 | -7 to +8 | -5 to +5 % |
| 165 | 159, 158, 170, 168, 165, 164, 162, 158, 161 | -7 to +5 | -4 to +3 % |
| 180 | 174, 170, 173, 178, 179, 172, 175, 173, 176 | -10 to -1 | -5 to -1 % |
You’ll notice that the margin of error is quite high. We seem to have gotten errors up to +/- 8 beats per minute. That won’t do. Clearly, our heart pulse wheel is not exercising Fitbit in the same as our wrist exercises Fitbit.
Side note: Fitbit heart rate displays a ‘–‘ if you continue the test for beyond a minute or so.
D’oh! The breakthrough
We were not happy with our results. So we started thinking to find other ways to test Fitbit heart rate monitor system. We thought about to use pipes and liquid to mimic blood flow. But that seemed pretty involved and we needed to study fluids and fluid dynamics. But then, suddenly, we realized we had made a mistake in the way Fitbit was oriented with respect to the heart pulse wheel. We had kept Fitbit in parallel to heart pulse wheel i.e. kept in parallel to blood flow. But blood in our wrists flows perpendicular to Fitbit. We corrected the placement of Fitbit by keeping it perpendicular with heart pulse wheel.
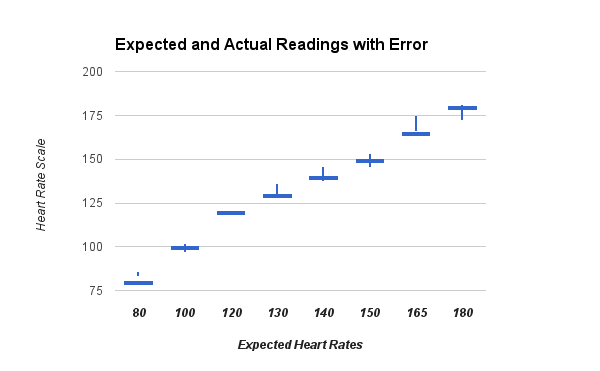
And voila!! Look at the following fig. 7 for actual reading and expected reading after placing Fitbit in perpendicular with heart pulse wheel.
After keeping Fitbit perpendicular with heart pulse wheel, we observed, it working in a similar way like when we wear on our wrist. I exercised it for 8 to 10 mins and also varied motor speed i.e. heart rate. Fitbit kept up with the variations. We repeated 6 test steps mentioned above for approximately 10 times for each expected reading and took notes of expected and actual reading as shown in Table 2. We analyzed collected data and plot a candlestick chart as shown in fig. 8.
| Table 2. Results when Fitbit is kept in perpendicular with heart pulse wheel | |||
| Expected heart rate | Actual heart rate readings | Error range | Error range (%) |
| 80 | 85, 85, 84, 84, 84, 84, 84, 84, 83, 83 | +3 to +5 | +4 to +6 % |
| 100 | 99, 99, 97, 99, 101, 102, 99, 100, 99, 98 | -3 to +2 | -3 to +2 % |
| 120 | 118, 121, 120, 121, 120, 118, 119, 119, 118, 121 | -2 to +1 | -2 to +1 % |
| 130 | 132, 134, 133, 130, 133, 134, 129, 135, 132, 131 | -1 to +5 | -1 to +4 % |
| 140 | 142, 137, 143, 144, 137, 142, 143, 145, 143, 143 | -3 to +5 | -2 to +3 % |
| 150 | 146, 145, 146, 149, 150, 151, 153, 148, 149, 147 | -5 to +3 | -3 to +2 % |
| 165 | 172, 173, 166, 175, 172, 169, 173 | +1 to +10 | -1 to +6 % |
| 180 | 174, 179, 175, 181, 173, 172, 175, 174 | -8 to +1 | -4 to +1 % |
Suggested improvements
To solve the problem of getting high error tolerance and to minimize error in % to the even lower value say +/- 2, we think using a tracked wheel arrangement will help. Look at Tracked wheel/ tank wheel arrangement shown here. It requires single stepper motors to rotate both wheels. On the belt, we need to stick different colored craft paper to mimic heart pulses. Connect stepper motor to one of tank wheel and place Fitbit near to another wheel. This tank arrangement keeps Fitbit away from stepper motor noise and may we get more accurate result.
There you have it! We used colored paper, a stepper motor and an Arduino to test the Fitbit heart rate monitor. If you found it interesting, drop me a note below in the comments.
If you are a startup finding it hard to hire technical QA engineers, learn more about Qxf2 Services.

I love technology and learning new things. I explore both hardware and software. I am passionate about robotics and embedded systems which motivate me to develop my software and hardware skills. I have good knowledge of Python, Selenium, Arduino, C and hardware design. I have developed several robots and participated in robotics competitions. I am constantly exploring new test ideas and test tools for software and hardware. At Qxf2, I am working on developing hardware tools for automated tests ala Tapster. Incidentally, I created Qxf2’s first robot. Besides testing, I like playing cricket, badminton and developing embedded gadget for fun.

