I wanted to draw a network of nodes and use the thickness of the edges between the nodes to denote some information. Since I had used NetworkX a long time ago for drawing network graphs, I decided to use it again. This was going to be a one off visualization. So I did not want to spend too much time studying NetworkX.

I started by searching Google Images and then looked on StackOverflow for drawing weighted edges using NetworkX. Surprisingly neither had useful results. The NetworkX documentation on weighted graphs was a little too simplistic. It also annoyed me that their example/image will not immediately catch the eye of someone performing an image search like I did.
So I am writing this post and adding a couple of images in the hope that it helps people looking for a quick solution to drawing weighted graphs with NetworkX.
NOTE: The approach outlined here works well for a small set of nodes. I have not tried it on a large network.
The data
I like chess. So let us pretend I will be plotting how often Karpov, Kasparov, Kramnik and Anand played each other in classical chess. The data (as of Aug 2017) looks like this:
1. Karpov – Kasparov: 170 classical games
2. Karpov – Kramnik: 15 classical games
3. Karpov – Anand: 45 classical games
4. Kasparov – Kramnik: 49 classical games
5. Kasparov – Anand: 51 classical games
6. Kramnik – Anand: 91 classical games
Drawing weighted edges with NetworkX
I won’t go over the process of adding nodes, edges and labels to a graph. I assume you know that. If you are new to NetworkX, just read through the well-commented code in the next section.
Instead, I will focus on how to draw edges of different thickness. The process of drawing edges of different thickness between nodes looks like this:
a) Iterate through the graph nodes to gather all the weights
b) Get unique weights
c) Loop through the unique weights and plot any edges that match the weight
d) Normalize the weights (I did num_nodes/sum(all_weights)) so that no edge is too thick
e) Make changes to the weighting (I used a scalar multiplier) so the graph looks good
a) Iterate through the graph nodes to gather all the weights
for (node1,node2,data) in G.edges(data=True): all_weights.append(data['weight']) #we'll use this when determining edge thickness |
b) Get unique weights
unique_weights = list(set(all_weights)) |
c) Loop through the unique weights and plot any edges that match the weight
#4 c. Plot the edges - one by one! for weight in unique_weights: #4 d. Form a filtered list with just the weight you want to draw weighted_edges = [(node1,node2) for (node1,node2,edge_attr) in G.edges(data=True) if edge_attr['weight']==weight] width = weight nx.draw_networkx_edges(G,pos,edgelist=weighted_edges,width=width) |
d) Normalize the weights
I did num_nodes/sum(all_weights) so that no edge is too thick
#4 e. I think multiplying by [num_nodes/sum(all_weights)] makes the graphs edges look cleaner width = weight*len(node_list)/sum(all_weights) |

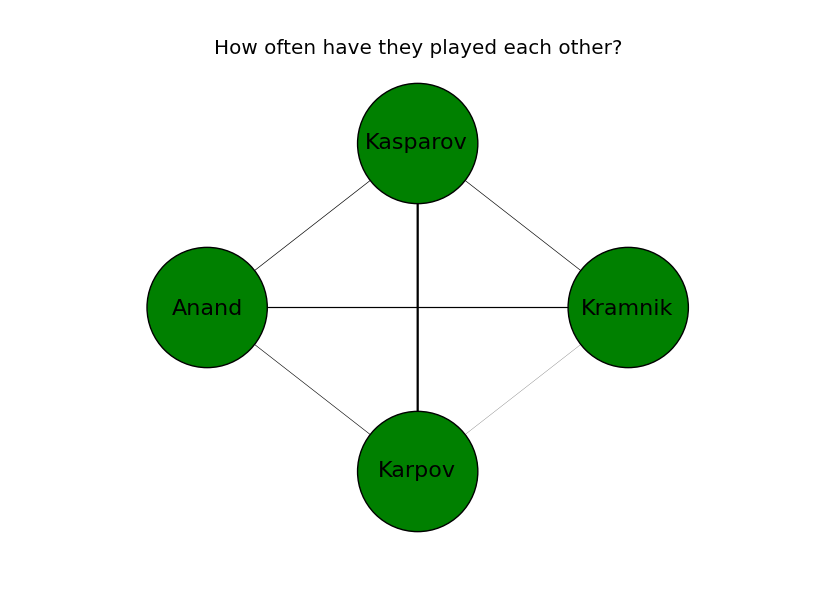
But the resulting graph had very thin edges. So I decided to multiply all thickness by a factor of 5.
e) Make changes to the weighting
I used a scalar multiplier of 5 so the graph looks good
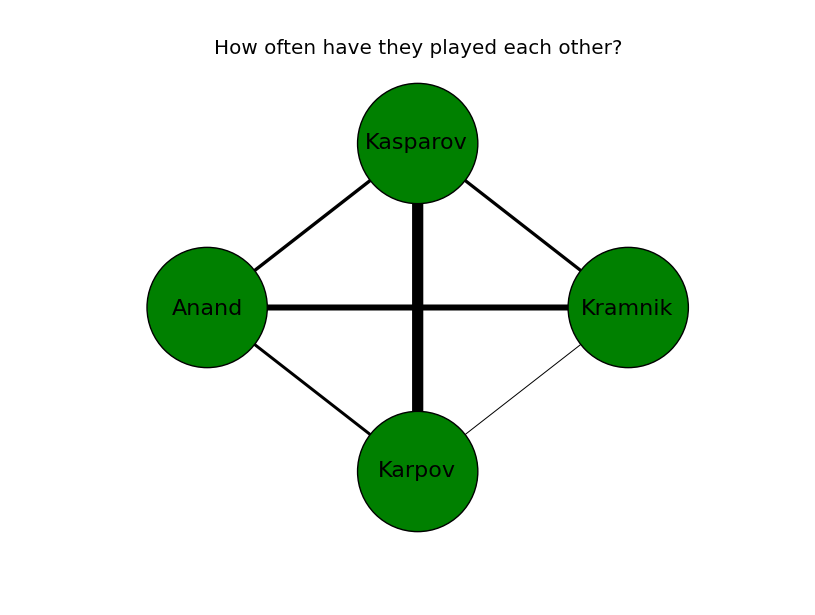
#4 e. I think multiplying by [num_nodes/sum(all_weights)] makes the graphs edges look cleaner width = weight*len(node_list)*5.0/sum(all_weights) |

Much better! I can quickly see that Karpov and Kasparov played each other many times. While Kramnik and Anand played each other quite a few times too. Given their respective ages and peaks, that makes sense.
Code for a network graph with different edge weights
I’ve added detailed comments to the code here. If you are new to NetworkX, it should help you get started quickly.
""" An example of drawing a weighted graph using the NetworkX module This is sample code and not indicative of how Qxf2 writes Python code --------------- I. The problem: --------------- I will be plotting how often these four world chess champions played each other: a) Anatoly Karpov b) Gary Kasparov c) Vladimir Kramnik d) Vishwanathan Anand ------------------------- II. Technical references: ------------------------- 1. https://networkx.github.io/documentation/networkx-1.9/examples/drawing/weighted_graph.html 2. https://stackoverflow.com/questions/28372127/add-edge-weights-to-plot-output-in-networkx ----------------------------------------- III. Reference for data (as of Aug 2017): ----------------------------------------- 1. Karpov - Kasparov: 170 classical games http://www.chessgames.com/perl/chess.pl?pid=15940&pid2=20719 2. Karpov - Kramnik: 15 classical games http://www.chessgames.com/perl/chess.pl?pid=20719&pid2=12295 3. Karpov - Anand: 45 classical games http://www.chessgames.com/perl/chess.pl?pid=20719&pid2=12088 4. Kasparov - Kramnik: 49 classical games http://www.chessgames.com/perl/chess.pl?pid=12295&pid2=15940 5. Kasparov - Anand: 51 classical games http://www.chessgames.com/perl/chess.pl?pid=12088&pid2=15940 6. Kramnik - Anand: 91 classical games http://www.chessgames.com/perl/chess.pl?pid=12295&pid2=12088 """ #1. Import pyplot and nx import matplotlib.pyplot as plt import networkx as nx def plot_weighted_graph(): "Plot a weighted graph" #2. Add nodes G = nx.Graph() #Create a graph object called G node_list = ['Karpov','Kasparov','Kramnik','Anand'] for node in node_list: G.add_node(node) #Note: You can also try a spring_layout pos=nx.circular_layout(G) nx.draw_networkx_nodes(G,pos,node_color='green',node_size=7500) #3. If you want, add labels to the nodes labels = {} for node_name in node_list: labels[str(node_name)] =str(node_name) nx.draw_networkx_labels(G,pos,labels,font_size=16) #4. Add the edges (4C2 = 6 combinations) #NOTE: You usually read this data in from some source #To keep the example self contained, I typed this out G.add_edge(node_list[0],node_list[1],weight=170) #Karpov vs Kasparov G.add_edge(node_list[0],node_list[2],weight=15) #Karpov vs Kramnik G.add_edge(node_list[0],node_list[3],weight=45) #Karpov vs Anand G.add_edge(node_list[1],node_list[2],weight=49) #Kasparov vs Kramnik G.add_edge(node_list[1],node_list[3],weight=51) #Kasparov vs Anand G.add_edge(node_list[2],node_list[3],weight=91) #Kramnik vs Anand all_weights = [] #4 a. Iterate through the graph nodes to gather all the weights for (node1,node2,data) in G.edges(data=True): all_weights.append(data['weight']) #we'll use this when determining edge thickness #4 b. Get unique weights unique_weights = list(set(all_weights)) #4 c. Plot the edges - one by one! for weight in unique_weights: #4 d. Form a filtered list with just the weight you want to draw weighted_edges = [(node1,node2) for (node1,node2,edge_attr) in G.edges(data=True) if edge_attr['weight']==weight] #4 e. I think multiplying by [num_nodes/sum(all_weights)] makes the graphs edges look cleaner width = weight*len(node_list)*3.0/sum(all_weights) nx.draw_networkx_edges(G,pos,edgelist=weighted_edges,width=width) #Plot the graph plt.axis('off') plt.title('How often have they played each other?') plt.savefig("chess_legends.png") plt.show() #----START OF SCRIPT if __name__=='__main__': plot_weighted_graph() |
References:
1. NetworkX documentation on weighted graphs
2. A StackOverflow answer that does not use NetworkX
I want to find out what conditions produce remarkable software. A few years ago, I chose to work as the first professional tester at a startup. I successfully won credibility for testers and established a world-class team. I have lead the testing for early versions of multiple products. Today, I run Qxf2 Services. Qxf2 provides software testing services for startups. If you are interested in what Qxf2 offers or simply want to talk about testing, you can contact me at: [email protected]. I like testing, math, chess and dogs.

Hi,
Thanks for sharing this. Just in case someone else stumbles upon your post, here is how I did it finally:
widths = [G.get_edge_data(*veza)[‘weight’] for veza in G.edges]
nx.draw_networkx_edges(G, pos=pos, width=widths, alpha=0.25, edge_cmap=plt.cm.viridis, edge_color=range(G.number_of_edges()));
Cheers!
Hello i wanted to ask in your opinion how you would use nx.all_simple_paths to find the longest path in a weighted undirected graph. It’s almost impossible for me because networkx only has the function for a directed graph and online it says that the negative cost of the shortest path is the key to find the longest path.