In this post we will show you how to use Developer Tools in your browser to inspect the API calls that your web application is making over the network. This post is the first in a series of posts on the following topics related to using APIs to test web applications:
APIs
An application programming interface (API) is a set of rules and specifications that software programs can follow to communicate or ‘interface’ with each other. It allows one piece of software to talk to other component using an agreed request and response format. APIs expose part of the functionality or data of one application which can be used by others on the Web. For web applications, the APIs are usually URL end points that return data in a specified format like JSON. These end points provide testers a convenient and robust way to automate some functionality of the application without having to use the user interface.
We have frequently used URL end points to test web applications. At a current client, we have relied heavily on the URL end points to setup complex test cases to verify the results of their algorithms for thousands of combinations of inputs. Performing the same checks via the UI would have been brittle, time consuming and expensive.
There are many APIs available online for you to practice your API testing. Almost all the popular sites provide public API’s so that other developers can design products that are powered by its service. Some of the popular web APIs are Google maps, Twitter, Facebook, etc. Searchable directories of APIs can be found at ProgrammableWeb and Mashape.
API Testing for web applications
As a tester, our job is to understand the API, come up with a good mix of input parameters, execute the tests on a given API, verify the result and expose any deviation in functionality. Testing APIs involves making HTTP requests (get, post, put, delete, etc) and then verifying the response. A developer does not have to necessarily tell you what API calls the web application is making. All modern browsers ship with what is termed as ‘Developer Tools’ to inspect what the application is doing under the hood. We can use the Developer Tools to inspect the requests and the responses made by the web application.
Using Developer Tools to check the API calls
In this post we will show you how to use Developer Tools in your browser to inspect the API calls that your web application is performing. For this tutorial we are using Firefox. It should be relatively simple to follow along with Chrome too.
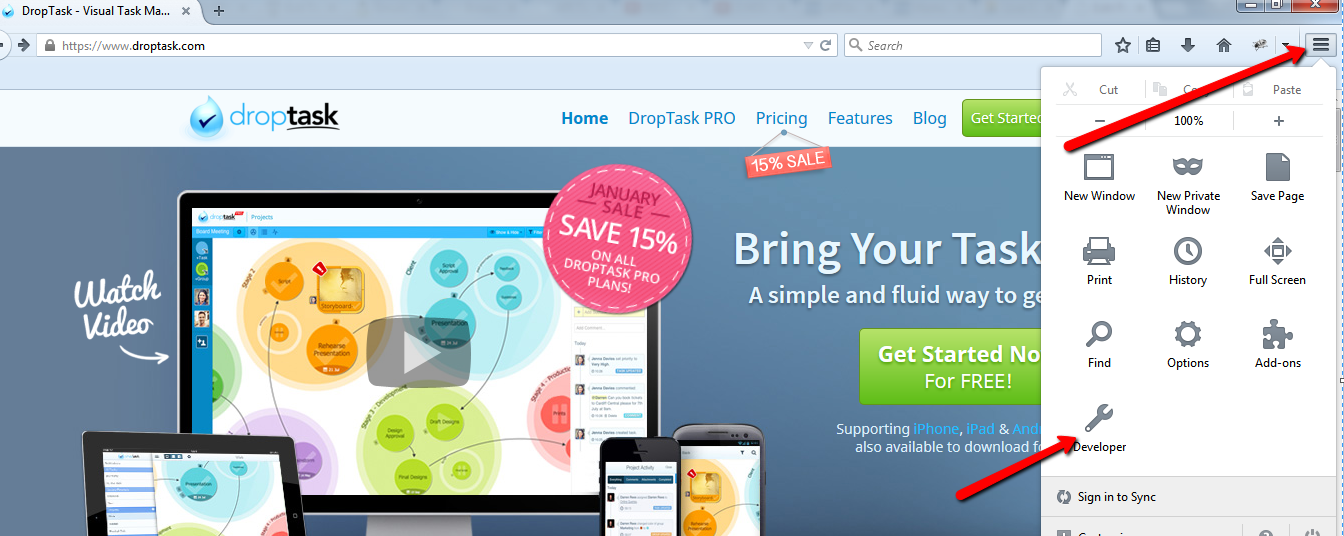
To launch Developer Tools on your Firefox Browser click on menu icon, then choose ‘Developer’ option.
Since we are interested in the calls made by the web application over the network, select Network in Web Developer list.
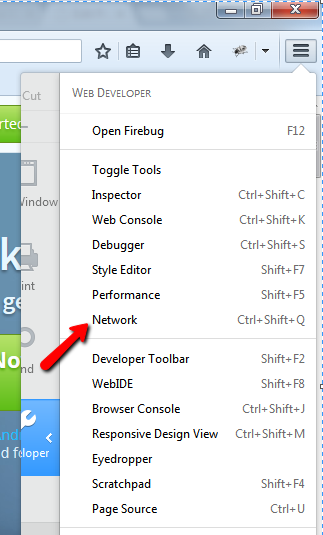
You can also use Ctrl+Shift+Q key to launch it directly.
Note: To launch Developer Tools on Chrome, you can right click anywhere on the page and choose ‘Inspect Element’. Then switch to the ‘Network’ tab. You could also use the F12 key on Windows.
Peek under the hood of a web application
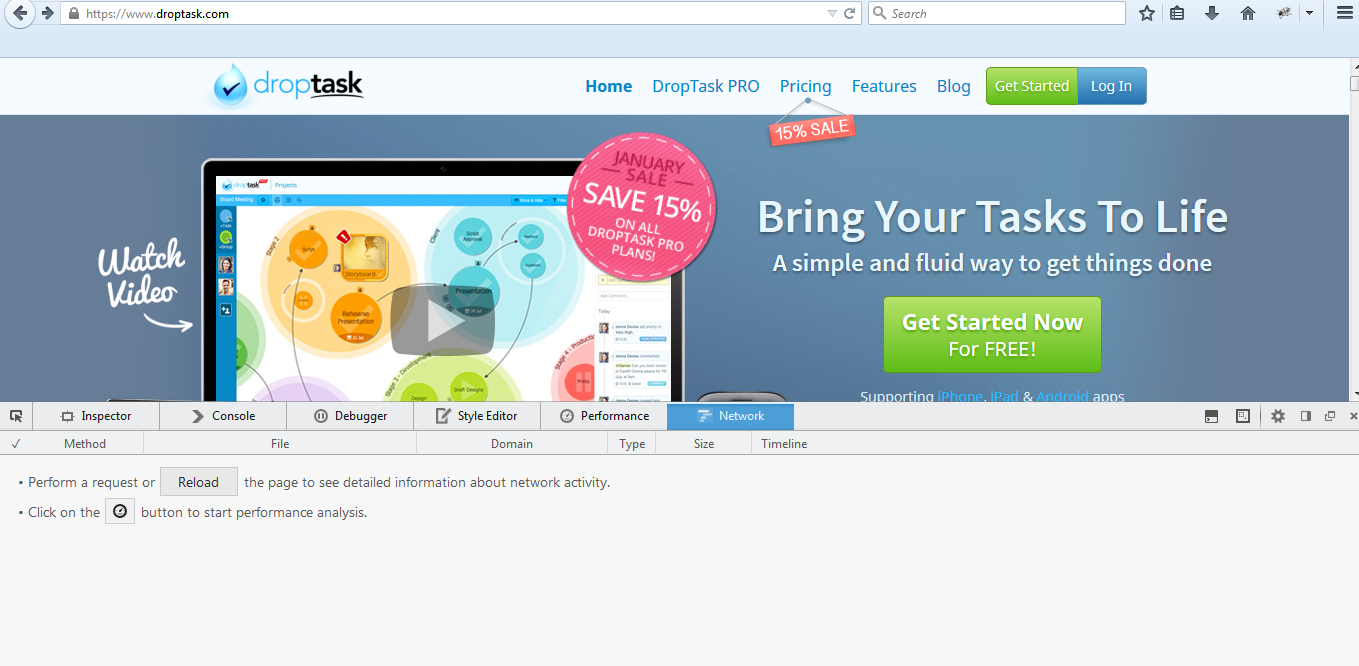
We will now see how you can use Developer Tools to check the different HTTP requests and responses. We will use DropTask as an example. DropTask is a free web based task and project management application that offers a visual approach towards managing daily workloads. For this tutorial, we will login to the DropTask application and figure out the different HTTP requests being made using Developer Tools.
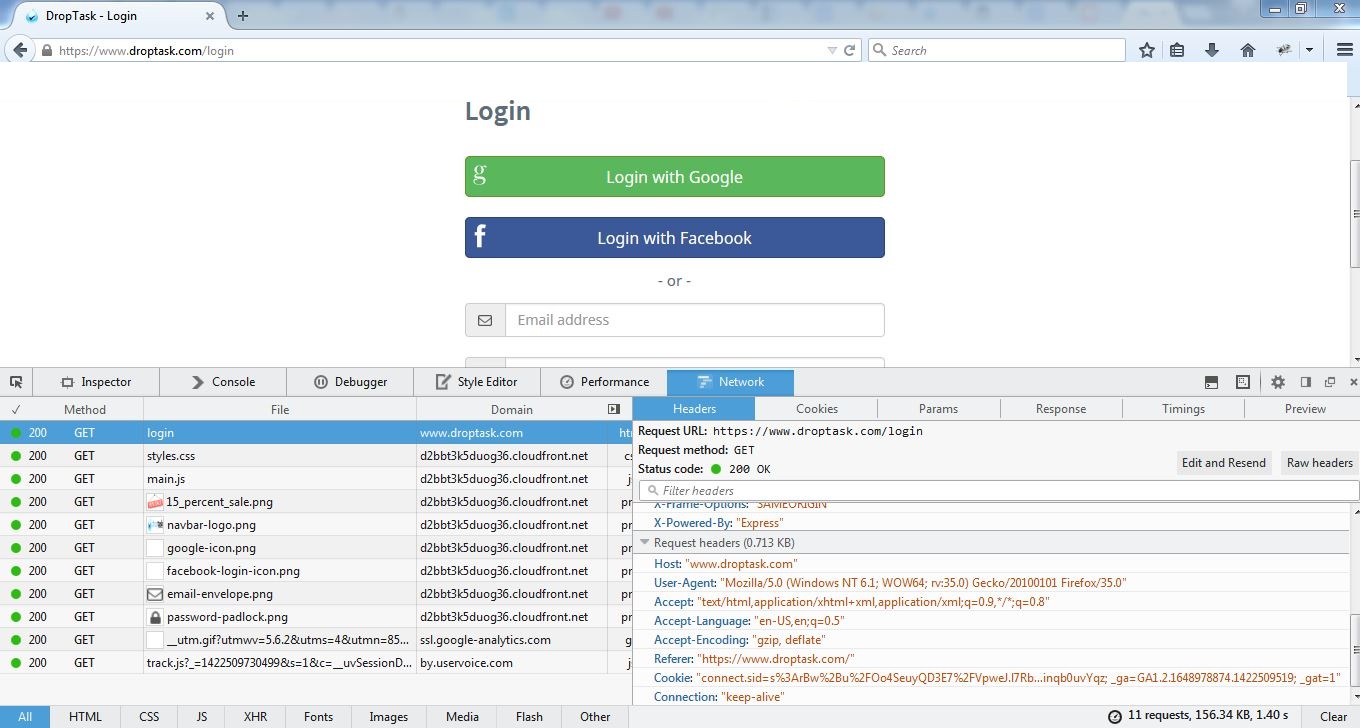
1. GET request for DropTask Login Page
Load your Developer Tools in Firefox browser and navigate to login page. Once the page loads you can view many requests being made. Check the login GET request made to domain www.droptask.com. On the right side of Developer Tools options you can see the request URL, request method, Status code, request and response headers under the Headers tab. There are separate tabs for Cookies, Params, Response (data),Timings and Preview.
You can also view the response data which we receive for the GET request as shown below.
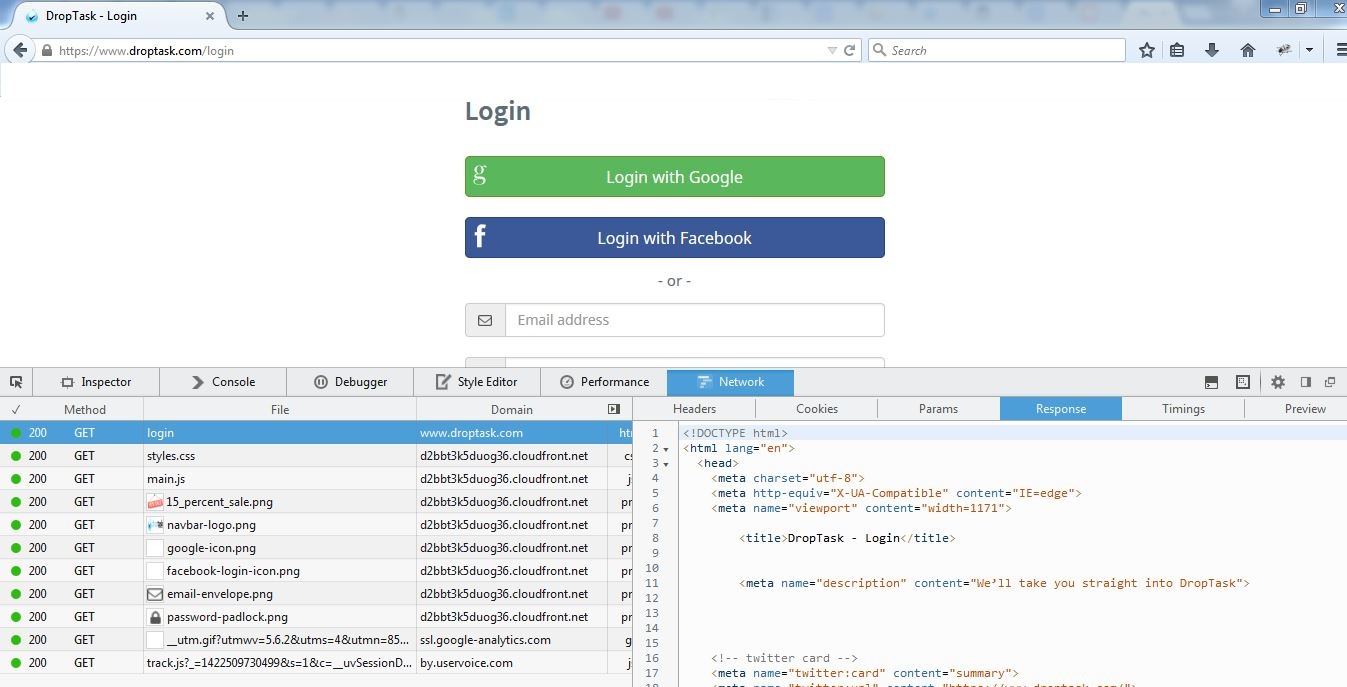
Note: You could filter by ‘XHR’ to see only the API calls being made
2. POST request with login parameters
When you login to DropTask with your email and password it will send a POST request to DropTask APIs as shown below
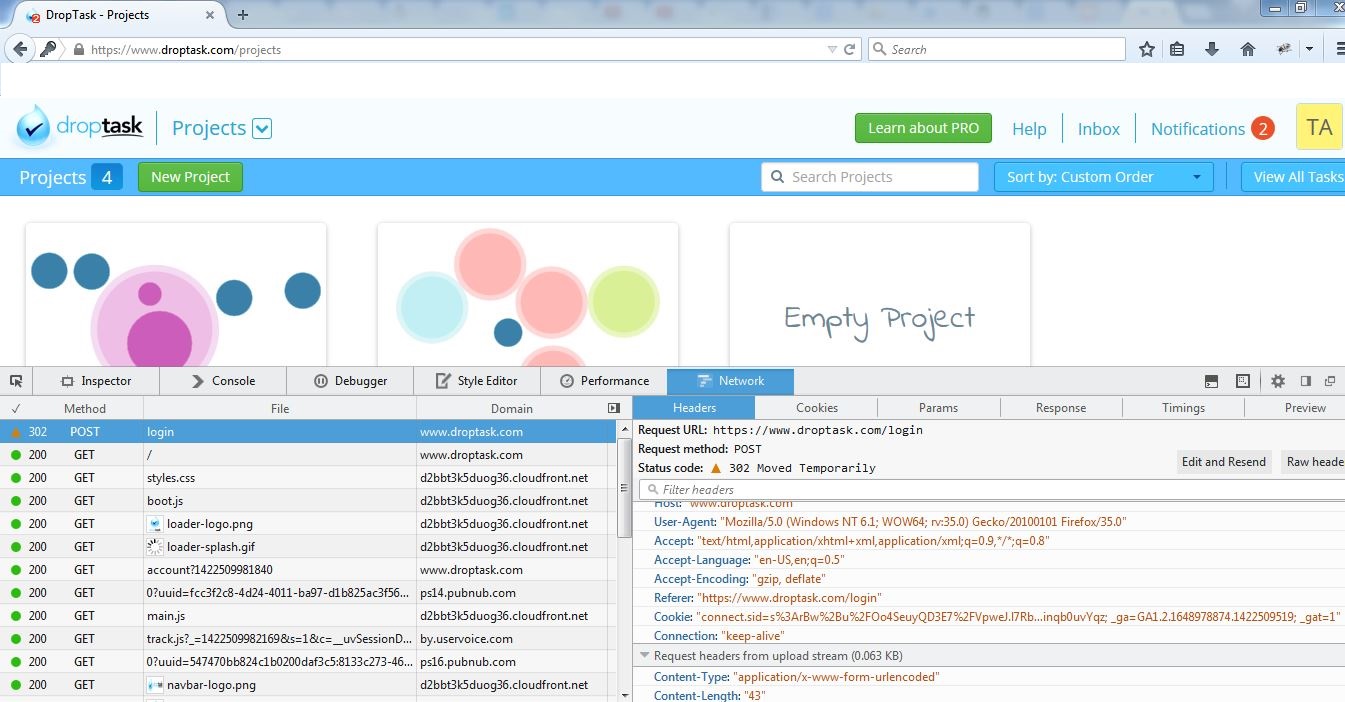
You can view the email and password being passed in the Params tab.
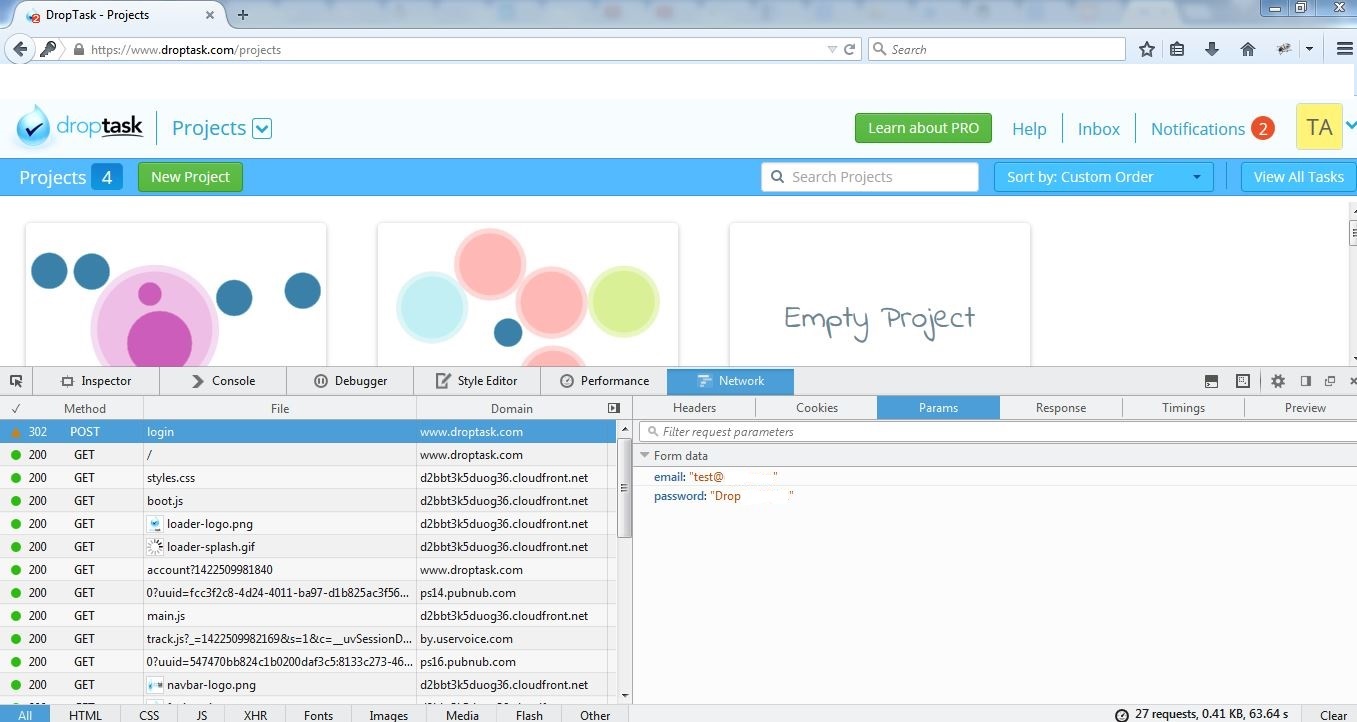
The response for the POST as expected in this particular case is empty.
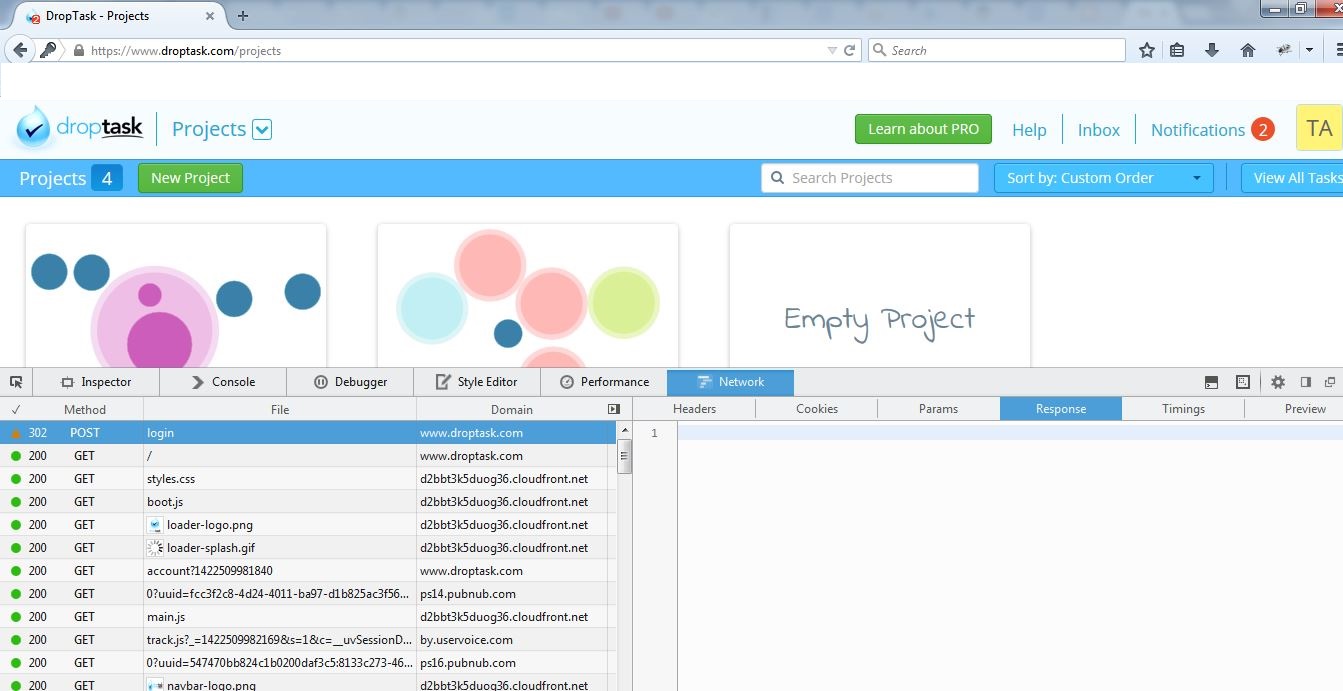
However you will notice that there is a subsequent GET request which returns all account details for the particular user.
3. GET request for Account Details
Here we guessed that a GET request is being made with the current Unix time as a parameter in the request URL.

You can view the query string in the Params tab.
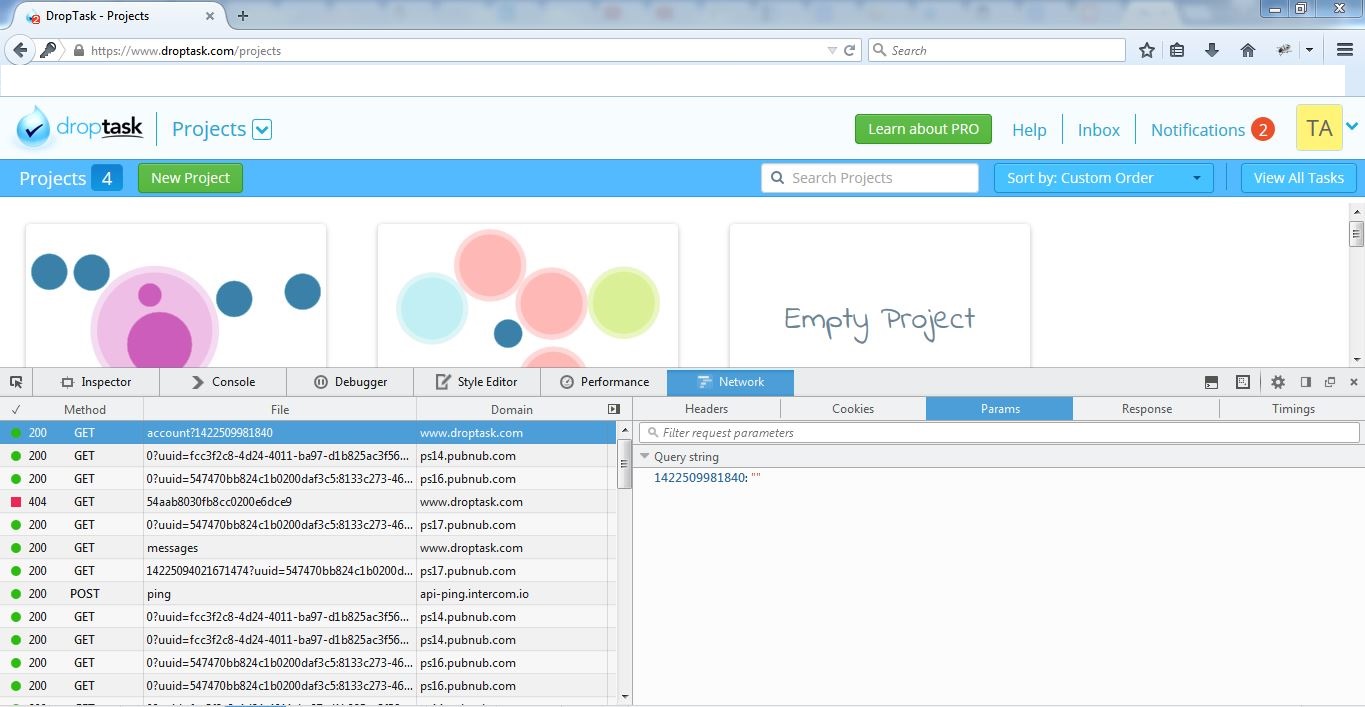
In the Response tab we can view the detailed JSON response which has all the Account details

Ah! So that’s how DropTask gets the details of the different tasks and projects for a given user: a GET request to /v1/account along with the current Unix time as a URL parameter. Notice that we learnt a whole lot about DropTask without having to ever speak to its developers!
Armed with the information we uncovered here, we are in a good spot to continue on our journey of using APIs to test web applications. Stay tuned for our next post in this series!
Expert QA services for growing startups
Qxf2 helps startups at every stage of growth by providing expert QA services that evolve with your product. If you’re struggling to keep up with testing demands or have accumulated testing debt, our team can help. Learn more about our specialized testing services for early-stage products and how we can bring your testing up to speed.

I am a dedicated quality assurance professional with a true passion for ensuring product quality and driving efficient testing processes. Throughout my career, I have gained extensive expertise in various testing domains, showcasing my versatility in testing diverse applications such as CRM, Web, Mobile, Database, and Machine Learning-based applications. What sets me apart is my ability to develop robust test scripts, ensure comprehensive test coverage, and efficiently report defects. With experience in managing teams and leading testing-related activities, I foster collaboration and drive efficiency within projects. Proficient in tools like Selenium, Appium, Mechanize, Requests, Postman, Runscope, Gatling, Locust, Jenkins, CircleCI, Docker, and Grafana, I stay up-to-date with the latest advancements in the field to deliver exceptional software products. Outside of work, I find joy and inspiration in sports, maintaining a balanced lifestyle.


good
Great, I need to learn more! Please keep posting!