In this blog post, we will implement outlier detection algorithms using Great Expectations. There is a socio-technical context to this blog post. On the social side of things, I want to emphasize that Great Expectations can be used to provide business folks information in a timely manner. On the technical side, we will look at how to use Great Expectations to write fuzzy checks. I am using the same real-world scenario use case described in my first blog post – Data validation using Great Expectations using real example. However, it is not necessary to be setup with the same. Read on to find out different outlier detection ways implemented and analyzed on varied data spike shapes.
Use Great expectations for more than just checks!
Using Great Expectations to simply run some deterministic tests that return a pass or a fail is good but somewhat limited and unimaginative. Given that we are running checks on data collected daily, we can be more creative. For example, we can provide business folks information about the trends we see in the data. These trends can act as early warnings or as bearers of good news!
In my example, we are collecting information about how Qxf2’s Github repositories perform. There are scripts that collect information on daily visitors, stars, clones and forks for every repository on a daily basis. We have a suite of tests (Great Expectations + CloudWatch) to ensure that the data being collected daily. However, we can do better! As an example, I would like to inform the team when a repository is becoming more popular and/or when the traffic to the repository is dying down. This is important information for the business folks who can then decide what to do with this information.
To be clear, these automated checks are providing information beyond what is correct and incorrect. As a testers, we get too caught up in just pass/fail judgements and forget that we can do a lot more. These automated checks are providing actionable insights into the trends that are observed in data. I am treating this as a “fuzzy checks” because the decision to label something as an outlier subjective. Further, there is nothing incorrect about an outlier. But observing that we have an outlier in the data will help the human in the loop to decide what to do next.
I know there is a ready-made expectation for outliers
The Great Expectations Gallery has a ready made expectations called expect_column_values_to_not_be_outliers. But I am going in great detail about how I ended up writing my own fuzzy test and how I validated if my expectations was working ok or not. I am doing this so that I can give other testers a peek into the kind of work that is needed to write your own fuzzy tests.
I did the work of looking commonly used outlier detection algorithms. But I did not stop there. I implemented a couple of outlier detection algorithms using Great Expectations. After that, I compared their performance against my data set. Not satisfied, I even tried tweaking the algorithms a bit to see if I could get a better fit for my data set. When I was close to being happy, I decided to simulate some synthetic datasets to model the kind of outliers that I might want my outlier detection algorithms to catch.
Please consider including such expectations in your test suite. I know as a tester you are feeling uneasy with the idea of such fuzzy tests. I know the results of fuzzy checks are messy and unclear. They require human attention and human decisions. But there is a LOT of value in including such checks in your tests suite. Case in point, I discovered an error in our data from September 2020 (!) because of these tests.
Writing fuzzy tests
I have been writing data quality tests using Great Expectations for one of the projects at Qxf2. When it comes to fuzzy checks, I observed its hard to define specific pass or fail criteria. In this blog post, I picked one such test which will check for any spikes in visitors columns of github_stats table. For more background, refer to my Data validation using Great Expectations with a real-world scenario blog.
The problem I am attempting to solve is a fuzzy test. this is because spikes can mean different things to different people. It can be a sharp increase compared to previous day or an increase related to the average number of visitors of that repo etc. Since these are so varied, I came up with few data shapes depicting spikes. To generate these spikes, I used synthetic data. While I will not go into those details of data creation, let us see the different data shapes that we can consider.
Data shapes for spikes
Here are the graphs that show generated spikes for visitors (of github_stats table). This is monthly data for one of the Qxf2’s popular open-sourced repositories – Page Object Model. The x-axis represents the number of days and y-axis the number of visitors.
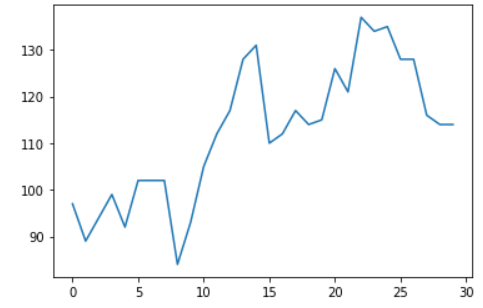
a) Original data
This graph shows the actual unique number of visitors for POM GitHub repository on each day. I have taken data of 30 days.
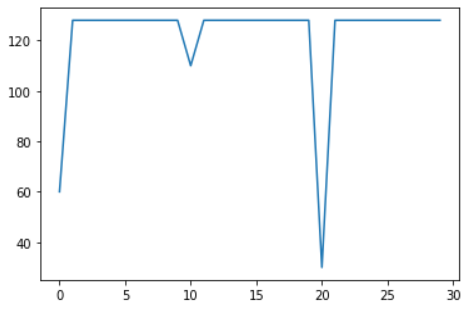
b) Single sharp spike and constant line
In this graph, I wanted to capture a sudden sharp increase and steady average number of visitors on each day thereafter.

c) Steady line with downward slope
Here, I wanted to see how gradual decline would like after initial steady state.

d) Sharp downward spikes
This is a classic spike, I got two downward ones.
Detect spikes using algorithms
There are various algorithms that help in detecting outliers or spikes.
Method 1: One Standard Deviation away from the mean
In statistics, standard deviation measures the spread of data around mean. For a normally distributed data, around 68.2% of the data will lie within one standard deviation from the mean.
lower_limit = 1sd below mean (mean – 1sd)
upper_limit = 1sd above mean (mean + 1sd)
spike = data_point < lower_limit and data_point > upper_limit
Method 2: Two Standard Deviations away from the mean
Similar to the above, we can also check 2sd away from the mean where 95% of data points reside.
lower_limit = 1sd below mean (mean – 2*sd)
upper_limit = 1sd above mean (mean + 2*sd)
spike = data_point < lower_limit and data_point > upper_limit
Method 3: Z-score
This measure checks the number of standard deviations a data point is away from the mean. Once the values of the distribution are converted to Z-scores, the center (or mean) becomes 0 and the z-score corresponding to each data point represents the distance from the center in terms of standard deviation. We need to provide a cut-off to identify spikes. Generally, 99.7% of values lie between -3 and +3. So, we will use the threshold value as 3.
Zscore = (data_point – mean) / standard deviation
Method 4: Inter Quartile Range
This score measures statistical dispersion by dividing dataset into quartiles. It is calculated as follows:
IQR = Q3 – Q1
lower_limit = Q1 – 1.5 * IQR
upper_limit = Q3 + 1.5 * IQR
spike = data_point < lower_limit and data_point > upper_limit
Implement outlier detection algorithms using Great Expectations
This section requires familiarity with Great Expectations. If you are new to this, do check out my previous blog posts. I have covered the basics of using this framework with an example.
We will use built-in expectations available out-of-box to implement the algorithms discussed above. I have outlined the steps to create an Expectation Suite with four expectations (or tests) each for implementing one algorithm. The same can be repeated for different data shapes i.e each data shape can have a suite. Here, I used RuntimeBatchRequest to run the expectations on the created synthetic data without the need for saving it to a CSV file.
1. First, let us create an Expectation Suite to store the expectations.
context = ge.get_context() expectation_suite_name = "github_visitors_downward_spikes" suite = context.create_expectation_suite( expectation_suite_name, overwrite_existing=True ) |
2. Then, load the batch of data into a dataframe.
Next, I generated synthetic data using simple Python logic. We will load the data, generated visitors into a dataframe which we can pass to the Checkpoint during runtime.
df = pd.DataFrame(generated_visitors, columns=['visitors']) |
3. Define a batch request and instantiate Validator
A Batch Request contains all the necessary details to query the data (available in dataframe in this case). A validator helps in running an Expectation Suite against a Batch Request.
batch_request = RuntimeBatchRequest( datasource_name="github_stats_datasource", data_connector_name="default_runtime_data_connector_name", data_asset_name="github_visitors_downward_spikes", # This can be anything that identifies this data_asset for you runtime_parameters={"batch_data": df}, # Pass your DataFrame here. batch_identifiers={"default_identifier_name": "default_identifier_name"}, ) validator = context.get_validator( batch_request=batch_request, expectation_suite_name=expectation_suite_name, ) |
4. Next, we will define the Expectations
Expectations are the assertions about data. Let’s define one for each algorithm.
Algorithm1: One Standard Deviation away from mean
We will first calculate the upper and lower boundaries and pass it to expect_column_values_to_be_between expectation.
import statistics visitors_mean = statistics.mean(pom_visitors) visitors_std = statistics.stdev(pom_visitors) upper_boundary = visitors_mean + visitors_std lower_boundary = visitors_mean - visitors_std validator.expect_column_values_to_be_between( column="visitors", min_value=lower_boundary, max_value=upper_boundary, meta= {"notes": {"This expectation checks if values are 1sd away from mean"}} ) |
Algorithm2: Two Standard Deviation away from mean
Calculate the upper and lower boundaries and pass it to expect_column_values_to_be_between expectation.
import statistics visitors_mean = statistics.mean(pom_visitors) visitors_std = statistics.stdev(pom_visitors) upper_boundary = visitors_mean + 2*visitors_std lower_boundary = visitors_mean - 2*visitors_std validator.expect_column_values_to_be_between( column="visitors", min_value=lower_boundary, max_value=upper_boundary, meta= {"notes": {"This expectation checks if values are 2sd away from mean"}} ) |
Algorithm3: Z-score
We will use the expectation expect_column_value_z_scores_to_be_less_than.
validator.expect_column_value_z_scores_to_be_less_than( column="visitors", threshold=2, double_sided=True, meta= {"notes": {"This expectation checks if Z-score values are below the set threshold level"}} ) |
Algorithm4: Inter Quartile Range
Similar to Algorithm1, we will calculate the upper and lower boundaries and pass it to expect_column_values_to_be_between expectation.
q1 = df["visitors"].quantile(0.25) q3 = df["visitors"].quantile(0.75) iqr = q3 - q1 upper_boundary = q3 + 1.5*iqr lower_boundary = q1 - 1.5*iqr validator.expect_column_values_to_be_between( column="visitors", min_value=lower_boundary, max_value=upper_boundary, meta= {"notes": {"This checks if values fall between Inter Quartile Range"}} ) |
4. Save the above expectations to the expectation suite.
validator.save_expectation_suite(discard_failed_expectations=False) |
Note: Since we are using same expectation(expect_column_values_to_be_between) twice, the second one might overwrite the first one. If this happens, add the expectation directly to the
5. Finally, run the checkpoint which will trigger the expectation run.
results = context.run_checkpoint( checkpoint_name="data_shapes_checkpoint", validations=[ {"batch_request": batch_request} ], ) |
The data_shapes_checkpoint was an existing checkpoint which I had created for this purpose.
Similar to above, I repeated the steps for other shapes as well.
Results from running the different outlier detection algorithms
I ran the expectation suites and recorded the results, noting the unexpected values the tests caught. Which will be the spikes in our case. I put everything together in the form a simple matrix.
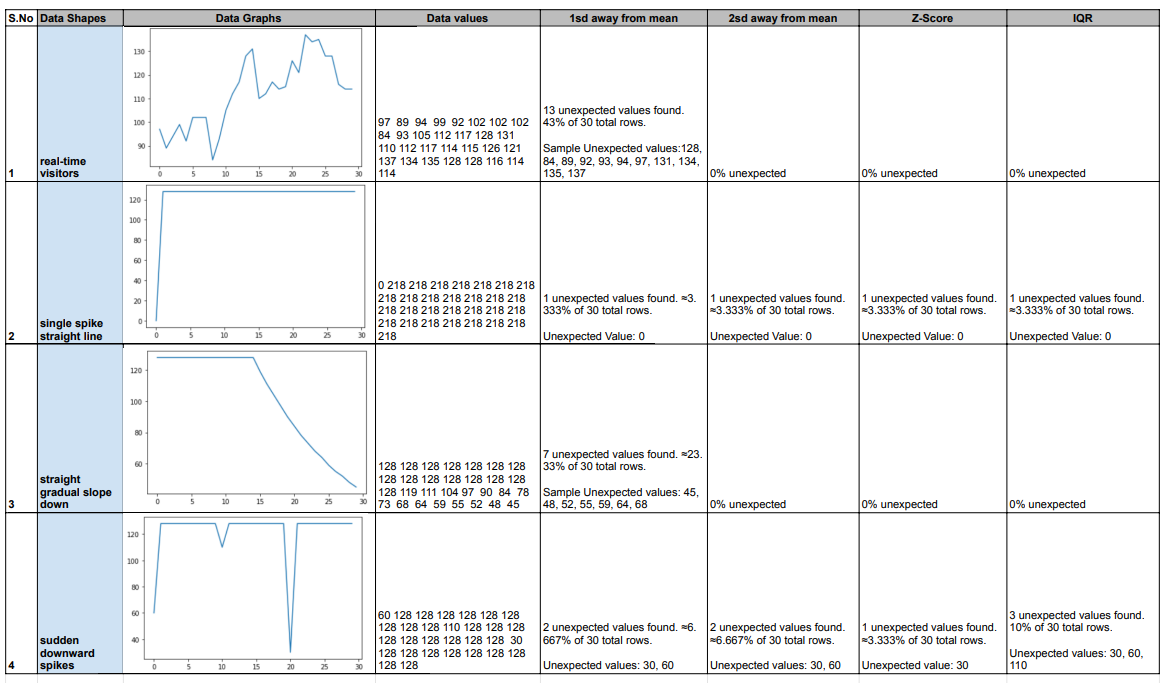
We can see that all the algorithms were able to detect the spike in case of shape 2, where there was a single sharp spike. Similarly, spikes in shape 4 were straightforward to catch too. Though Z-score could only catch one among the three spikes. For shape 3, 1sd away from mean listed out few unexpected values. Considering a gradual decline, there was supposedly no spikes in this case. Going for a 2 or 3sd might help here. Same with the real-time data. Here, 1sd did list out a few unexpected values while the other two algorithms dint have any. Though there was an increase around day 8 to day 13, it was probably not considered a spike since it was a gradual and not a sudden increase.
Though the above shapes might not map exactly to how real-time data works it gives a fair idea for choosing a particular algorithm. We would want our tests to help business take decisions based the results. For instance, in the above case, can plan to promote any repo. Say, by organizing an event on a day and check if it caused any spike in visitors. Another instances can be if a popular repo suddenly loses its visitors and continues to be like that (like in shape 2). A spike detection there can help dig deeper into the downfall trend and take appropriate measure to bounce it back.
Those were a few real-life examples I could bring out with my analysis. I hope you find this useful too and draw suitable inferences according to your use case.
Next steps
I am tinkering with Metric Stores right now. You can use them to collect data about the data. I am eager to try them out and produce something which would hopefully be useful to the testing community as well. Stay tuned for more blog posts in this series. Thanks for reading!
I have been in the IT industry from 9 years. I worked as a curriculum validation engineer at Oracle for the past 5 years validating various courses on products developed by them. Before Oracle, I worked at TCS as a Manual tester. I like testing – its diverse, challenging, and satisfying in the sense that we can help improve the quality of software and provide better user experience. I also wanted to try my hand at writing and got an opportunity at Qxf2 as a Content Writer before transitioning to a full time QA Engineer role. I love doing DIY crafts, reading books and spending time with my daughter.