In this blog post, we will explore the metric store and evaluation parameters feature of Great Expectations. These help us track data about our data collection. I will help you write a test to keep track of table row count using Great Expectations. This post is fifth in our series to help testers implement useful tests with Great Expectations for data validation. Read on to understand how keeping track of a simple yet useful test like daily row count of a table provides valuable insights for further analysis.
Notes:
1. This post requires familiarity with Great Expectations. If you are new to this, do check out my previous blog posts. I have covered the basics of using this framework in detail.
2. To show the table row count test, I will be using the same real-world scenario use case described in my first blog post – Data validation using Great Expectations using real example. The data file required is here. Ensure that you are setup with a Great Expectations deployment and have a FileBased Datasource that can read the CSV.
3. For the storage backend, I am going to use Postgres SQL database that I have setup locally. You can apply it to any other SQL database supported by Great Expectations.
Context
Looking at trends in data about the data collected (i.e. metadata) is often an intuitive heuristic for testers to spot problems in data collection. For example, if you collect data from external sources everyday as part of your MLOps or DataOps lifecycle, you are bound to have faced problems with incomplete data or partially collected data. This can happen due to many reasons like the data source API changing, the format of the data being collected changing, modified identifiers in the case of scraping, etc. As testers, we know something went wrong, because we ended up collecting lesser (or no) data that day. Tracking metadata about the data collected and then checking them for a range ends up being a super-useful check to have in place. In this post, I will show you how to implement one of these checks using Great Expectations.
If you are planning on implementing such tests …
To implement similar checks on metadata in your project, you should think of the following:
a) Metadata you want to track (e.g.: collection times, row count, etc.)
b) Condition/trend you want to check for (e.g.: within a certain range, exactly equal to yesterday, less on weekend, etc.)
c) Batch of data you want step b) working upon (e.g.: monthly metadata, daily metadata, etc.)
I have tried to make step b) and c) trivial in my example so you can play along easily with this post. For the condition, I choose exactly equal to previous and for the batch of metadata, I choose daily data.
About the example test
At Qxf2, I have been writing data quality tests using Great Expectations for one of the projects. To give a bit of context, the portion of the project that I work on keeps track of data related to all the open-sourced GitHub repositories under Qxf2. As I worked on implementing and adding more tests to it, I reflected upon the importance of having tests around metadata. To being with, I put up a test for checking table row count. In this blog, I will show how to implement it using Great Expectations and later look at how to perform some analysis with the results.
To start with, I picked a simple use case of sending a notification whenever a new repo gets added under Qxf2. For this, I put up a test to check number of rows of table which has the list of all the GitHub repos names under Qxf2. The test would compare the row count of current run with the previous one. When there is a difference, it would fail. Which would send out the notification. Over time gathering such metrics or metadata would help to provide valuable insights into data trends. To capture dynamic results as they are generated, I utilized Metric Store and Evaluation Parameters, a feature of Great Expectations which can help to store and use metrics. I felt it will be useful to go over it in detail in a blog post. Let us look at the steps in detail.
Breakdown
We will be doing the following steps:
-
1. Capture the validation results from previous Expectation run
-
1.1 Write table row count test
1.2 Setup Metric Store to store results from validation run
1.3 Verify that values are getting stored in the database
2. Compare the results between different runs
- 2.1 Query the database to fetch the required value
2.2 Define Evaluation Parameters to store the dynamically fetched value
2.3 Update the table row count test to use the Evaluation Parameter
3. Perform analysis using the results
Detailed Steps
Let us get into the technical implementation of each of them:
1. Capture the validation results from previous Expectation run
In this section, we will first write the test to check the total number of rows of github_substreams table. This is the table which consists of all the GitHub repositories under Qxf2. To store the results, we will configure a Metric Store. As the name suggests, a Metric Store is used to store and retrieve Metrics which are computed attributes or data about data. Saving such information which is computed during validation runs will help in performing analysis later. Finally, we will verify if the data is getting stored in the database.
1.1 Write table row count test
Skip this section if you already have a test that checks table row count. I have created a new Expectation Suite for this test. You could always use an existing one. Add a table level expectation. The one we want is ‘expect_table_row_count_to_equal‘. For this first run, I will compare it with the actual number of rows in the table which I know is 55.
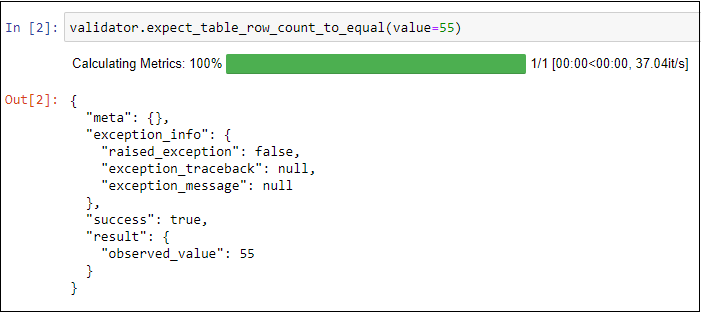
Here, we can see that the number of rows in the table result is getting saved into observed_value. We will store this value as metric and later use for comparison.
Further, I have created a checkpoint to run the above expectation suite. We will be adding the metric there.
1.2 Setup Metric Store to store results from validation run
We will now configure a Metric Store which will track details such as run_id, Expectation Suite name and other specific requested values. All these are stored in a table called ge_metrics which gets created during the first run. To setup Metric Store, we would need to perform the following steps:
i) Add a MetricStore store to our Data Context
The config information of our Great Expectations deployment resides in the great_expectations.yml file. So, we will add our new store here. Go the stores section of the file and add the following code. We need to provide two required keys – the class_name which must be MetricStore and the store_backend which is DatabaseStorageBackend since we are using DB as storage.
metric_store:
  class_name: MetricStore
  store_backend:
    class_name: DatabaseStoreBackend
credentials: ${qelo_postgres_db_creds} |
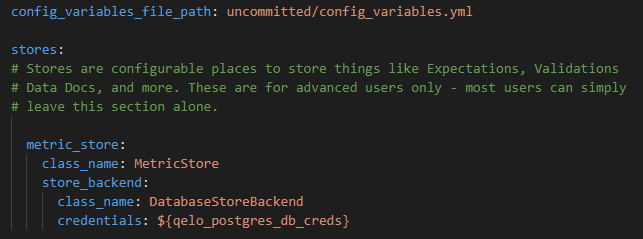
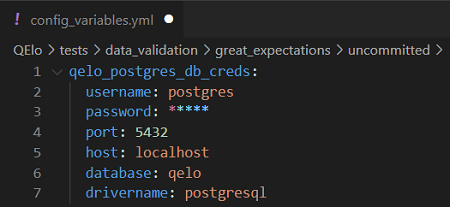
We can save the credentials inline or use the config_varaiables.yml file present under uncommitted folder (by default provided by Great Expectations). I placed the credentials in the yml file temporarily for local setup. The following information is required, update it according to your values.
qelo_postgres_db_creds: username: postgres # default username provided by postgres password: <your_password> port: 5432 # default port used by postgres host: localhost database: qelo # the database I created for this project drivername: postgresql |
ii) Add an Action to the Checkpoint to define the Metrics
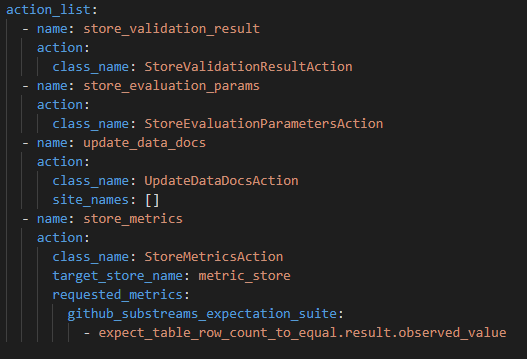
Edit the Checkpoint which is used for running the row count test to add a new Action. We will use StoreMetricsAction action type which will help in saving Metrics during validation. To define the action, provide the following:
* class_name – must be StoreMetricsAction
* target_store_name – specify the backend for storing metrics. We have already defined the backend in earlier step while adding the MetricStore. Provide the same key name here. In our case, it is metric_store.
* requested_metrics – provide details regarding the Expectation Suite and the corresponding Metrics we want to store.
- name: store_metrics
  action:
    class_name: StoreMetricsAction
    target_store_name: metric_store
    requested_metrics:
      github_repos_tracker_suite:
- expect_table_row_count_to_equal.result.observed_value |
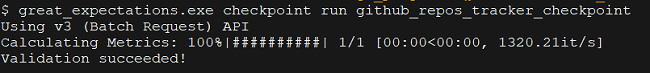
1.3 Run the checkpoint
To see the changes we made, let us run the checkpoint. Make sure to install sqlalchemy and psycopg2.
I used the CLI command:
great_expectations checkpoint run github_repos_tracker_checkpoint
Run the steps in the Jupyter noteboook. It will initialize the Data Context and run the Expectation Suite having the table row count test.
Next, let us check the database to see if the requested metrics have been added.
1.4 Verify Metrics are stored in the database
As noted earlier, for storing the metrics I used Postgres. For this project, I created a database called qelo. Using the psql shell, I logged in and connected to the database. And then ran a query to see the tables that are present:
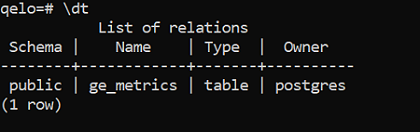
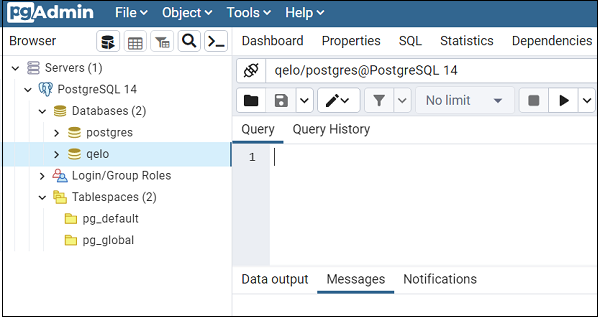
We see that a table with name ge_metrics is present. This is the one that gets created whenever Checkpoint with Metrics is run. Next, we will perform a query to fetch the data from the table. To run queries, I used pgAdmin tool. Open the Query Tool present under Tools
Run the query select * from public.ge_metrics;
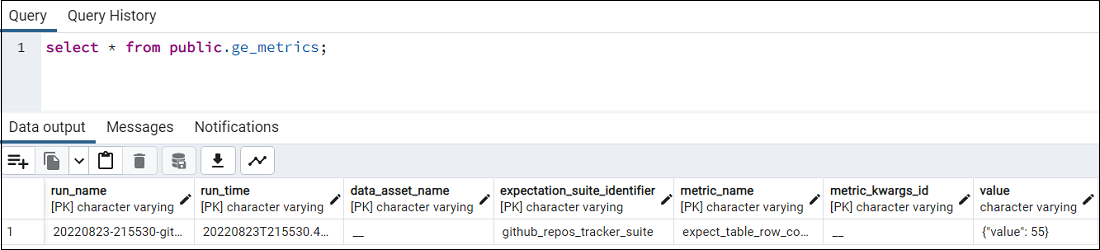
We see that a row has been created with results of our earlier checkpoint run. The result of “expect_table_row_count_to_equal.result.observed_value” metric we defined in the checkpoint, is getting stored in the “value” column. In the next section, we will see how to retrieve and use that value.
2. Compare the results between different runs
So far we have captured the information that is required, let us now see how we can use that in our test. We will use Evaluation Parameters which will help in enabling us to use dynamic values in Expectations. In our case, we want the table row count of previous run which has been stored in the ge_metrics table of postgres database. So, we will write a query to fetch the latest value dynamically(for every run).
2.1 Query the database to fetch the required value
First, we will frame the query to fetch the required value from the database. We want the most recent value present in the column “value”. This is stored in the format of {“value”:55}. So, once we fetch the value, we will further extract the number by using value::json->>’value’. The complete postgres query would be:
SELECT (value::json->>'value')::int as value FROM public.ge_metrics where metric_name = 'expect_table_row_count_to_equal.result.observed_value' order by run_time desc limit 1 |
Next, we will be using this query while defining Evaluation Parameters.
2.2 Define the Evaluation Parameters to store the dynamically fetched value
Similar to what we have done earlier while adding Metric Store, we will edit the great_expectations.yml file to add another store. This will be an SQlAlchemy Query store that will query the connected database and return the result of the query as an Evaluation Parameter.
Go to the stores section and add the below configuration.
ge_table_metric_store: # store name can be anything class_name: SqlAlchemyQueryStore credentials: ${qelo_postgres_db_creds} # the creds we had stored earlier queries: substream_value: # evaluation parameter name query: "SELECT (value::json->>'value')::int as value FROM public.ge_metrics where metric_name = 'expect_table_row_count_to_equal.result.observed_value' order by run_time desc limit 1" return_type: "scalar" # this is necessary, else it will default to list |
Next, let us update the Expectation with the this Evaluation Parameter.
2.3 Update the table row count test to use the Evaluation Parameter
In our table row count test, we will now update the hard-coded value which we used initially with the above Evaluation Parameter. To refer to it, we need to use the following
format. It is a store-style URN starting with urn:great_expectations:stores. This is followed by store name and finally the name of the parameter we defined above.
“$PARAMETER”: “urn:great_expectations:stores:ge_table_metric_store:substream_value”
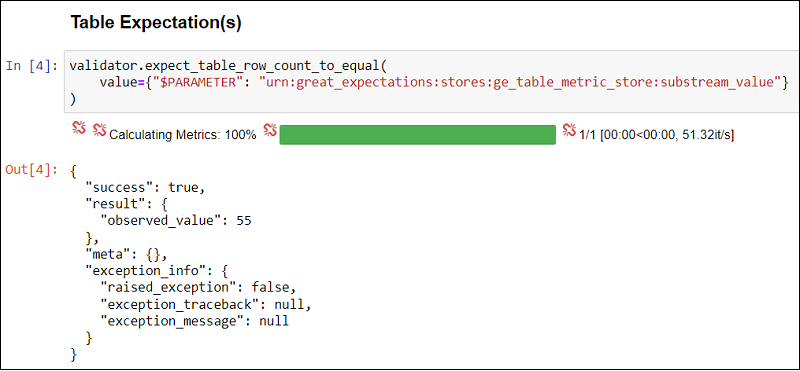
The updated test will look like:
validator.expect_table_row_count_to_equal( value={"$PARAMETER": "urn:great_expectations:stores:ge_table_metric_store:substream_value"} ) |
Now, whenever this expectation will run, it will compare the current value with the value of the previous run (dynamically stored in substream_value Evaluation Parameter).
We are now set with using dynamic results in our Great Expectations test.
Other use cases of tracking row count test
Depending on the scale and nature of a project, there can be various ways we can utilize the table row count results. In my case, I used it to send a notification whenever there is an increase or decrease in the number of repos. Taking another example, if I am working with a scraper, I might want to make sure that I get ~ X +- 50% new rows of data every day. So keeping track of daily row count helps. Another generic case can be, for instance, a scenario where a retail business keeps track of the number of customers that come to their store on a daily basis. Tracking this data over time will help the business design appropriate strategies to attract customers and have an edge over their competitors.
Next Steps
I plan to explore the concept of batching especially for big data sets. I am eager to try them out and produce something which would hopefully be useful to the testing community as well. Stay tuned for more blog posts in this series. Thanks for reading!
References
1. https://docs.greatexpectations.io/docs/guides/setup/configuring_metadata_stores/how_to_configure_a_metricsstore/
2. https://docs.greatexpectations.io/docs/guides/expectations/advanced/how_to_dynamically_load_evaluation_parameters_from_a_database/
3. https://phoenixnap.com/kb/install-postgresql-windows
I have been in the IT industry from 9 years. I worked as a curriculum validation engineer at Oracle for the past 5 years validating various courses on products developed by them. Before Oracle, I worked at TCS as a Manual tester. I like testing – its diverse, challenging, and satisfying in the sense that we can help improve the quality of software and provide better user experience. I also wanted to try my hand at writing and got an opportunity at Qxf2 as a Content Writer before transitioning to a full time QA Engineer role. I love doing DIY crafts, reading books and spending time with my daughter.