I am sharing some tips and tricks on cleaning data and restructuring the data you are using for testing.
Why this post?
Qxf2 works with many data intensive applications. I’ve noticed a pattern – my colleagues hit very similar data related problems across many different projects. That got me thinking critically about test data. I was thrilled to stumble upon an excellent paper on Tidy Data that has helped me understand and articulate the problems with poorly structured data better. I’m sure a lot of people in the world of data science already know about this paper. But this blog is geared towards testers and I don’t know of too many testers who have been exposed to the idea of clean data. So I thought it would be worth writing a post to expose testers to the concept of tidy data. In addition to tidying data, I thought I would give you some examples of cleaning operations we have used on various projects.
Should QA think about designing data?
Yes. We think so. It has worked very well for us. Qxf2 has been testing many data intensive applications. My colleagues have tested survey applications, data querying and visualization tools, healthcare algorithms, patient data, etc. We work with startups and early stage software. So, usually, we have the opportunity to study the data carefully and design our own data sets for testing purposes. This practice of designing rich data sets to enable testing, as opposed to using what data exists on production, has helped our engineering colleagues move faster and made our applications and algorithms be more robust to mistakes in data. A couple of technical auditors (technical audits happen when our clients seek investments/acquisitions) have praised QA’s approach to using designed test data. Designed test data also helps when testing the UI and makes for a good demo. So, usually, the time you spend designing good data is worth it.
How does a tester benefit from this post?
This post will help you think deeper about the data being used for testing. I think you can use the tips and tricks in this post in a few ways:
a) If you are completely new to working with data, this post is a good starting point
b) When you are testing parsers, you can purposely create ‘dirty’ data to ensure the parser remains robust and that the error messages are human-friendly.
c) When you are testing algorithms, you can design test data so that you test not only the key pieces of the algorithm but also test the algorithm’s validity against missing pieces of data, incorrect data, updated data, etc.
d) If you are scraping data and using it for your testing, you will learn to structure your data better
Setup for data cleaning
I’ve tried my best to keep this blog post self-contained. I’ve created a simple data set with some common mistakes in it. By the end of this post, we would have cleaned this data set. You can download patient_heart_rate.csv over here. I am using Python Pandas to clean the data. But you are welcome to use just plain old Python and write your own code instead of using my snippets. The goal is to learn about the common difficulties with cleaning data rather than to learn the Python code used to clean the data.
Get to know the data
In any process involving data, before we start working, our first goal should always be understanding what the data is and what we want to achieve. This process involves looking at the data and trying to understand the columns/rows of the data, no of records, the format of the data, semantic errors, missing entries, or inconsistent formatting, so it needs to be “cleaned” prior to analysis.
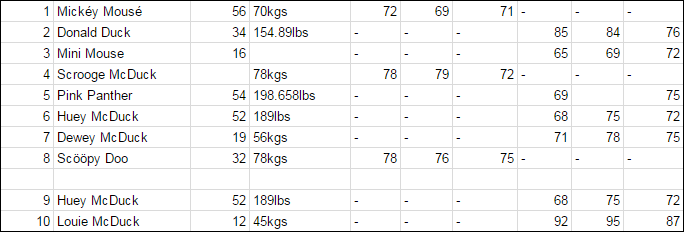
In this post, we will summarize some data tidying examples using Python libraries. For this purpose, we have created a patient_heart_rate.csv dataset as an example. The data set has been kept small enough for you to be able to grok it all at once. The data is in csv format. Each row in the dataset has data about different individuals and their heart rate details for different time intervals. The columns contain information such as individual’s Age, Weight, Sex and Heart Rates taken at different time intervals.
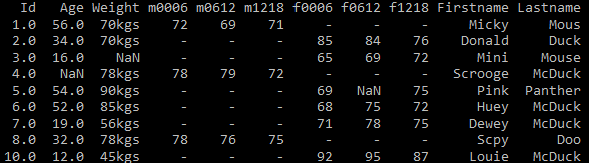
Here is how our dataset looks:
Problems in our dataset
For illustration purpose in the above dataset we have created each row with a problem as listed below:
1. Missing headers in the csv file
2. Multiple variables are stored in one column
3. Column data contains inconsistent unit values
4. Missing values
5. An empty row in the data
6. Duplicate records in the data
7. Non-ASCII characters
8. Column headers are values and not variable names
Cleaning Data
The following sections illustrate each problem in detail and show how to tidy them using Python Pandas library.
Problem 1 – Missing headers in the csv file
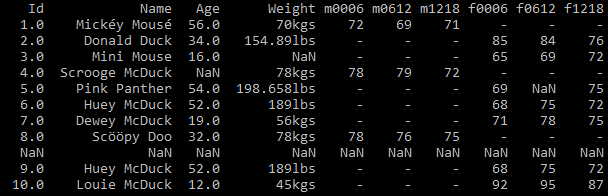
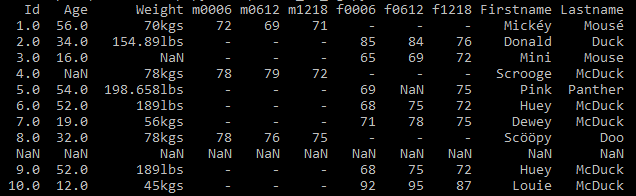
If you look at the data file you notice that there is no header (See Fig 1). Pandas is smart enough to figure out that the first line of the file is the header. We can still read the file if the csv file doesn’t have a header by manually providing the headers. Have a look at the below code.
import pandas as pd column_names= ["Id", "Name", "Age", "Weight",'m0006','m0612','m1218','f0006','f0612','f1218'] df = pd.read_csv("patient_heart_rate.csv", names = column_names) df.head() |
As shown above we can declare our own headers. We read the data in the same way, except this time we pass in a new variable names = column_names, to tell Pandas to use our headers, as the original file has none. See Fig 2
Problem 2 – Multiple variables are stored in one column
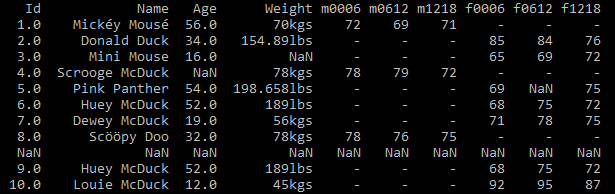
In this dataset patient_heart_rate, the Name column contains two variables Lastname and Firstname(See Fig 3). To respect the tidy principles, we want to isolate each variable in a single column.
import pandas as pd df = pd.read_csv("patient_heart_rate.csv") print (df) |
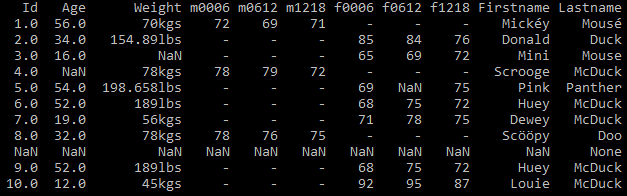
Technically, separating those two variables can be accomplished using the split function.
We used the vectorised str.split with expand=True, this will unpack the list into the new columns as shown below.
df[['Firstname','Lastname']] = df['Name'].str.split(expand=True) df = df.drop('Name', axis=1) print (df) |
Once you execute the above code, the data looks like this(Fig 4)
Problem 3 – Column data contains inconsistent unit values
If you observe in the dataset, the way the measurement unit was written for Weight column is not consistent. The second and seventh row contains data for inconsistent unit values (kgs,lbs). See Fig 5
The weight column is sometimes spelled as kgs, lbs etc., In order to resolve this we have written a python code to convert the measuring unit and represent weight column in kgs
import pandas as pd #Read the data set df = pd.read_csv("patient_heart_rate.csv") #Get the Weight column weight = df['Weight'] for i in range (0 ,len(weight)): x= str(weight[i]) #Incase lbs is part of observation remove it if "lbs" in x[-3:]: #Remove the lbs from the value x = x[:-3:] #Convert string to float float_x = float(x) #Covert to kgs and store as int y =int(float_x/2.2) #Convert back to string y = str(y)+"kgs" weight[i]= y print (df) |
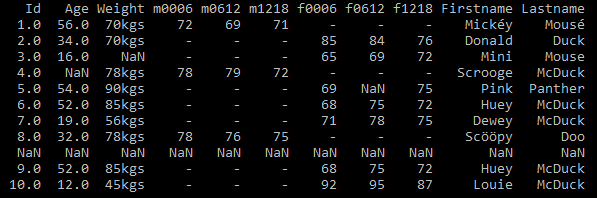
This results in a tidy dataset. See Fig 6
Problem 4 – Missing values
There are few missing values in the Age, Weight and Heart Rate values in the dataset. It is quite common for some values to be missing from datasets. This typically means that a piece of information was simply not collected. There are several options for handling missing data. But we encourage testers to talk to your subject matter experts about your missing data. Typical ways your subject matter experts will suggest handling missing values are:
a. Deletion: Remove records with missing values
b. Dummy substitution: Replace missing values with a dummy but valid value: e.g.: 0 for numerical values.
c. Mean substitution: Replace the missing values with the mean.
d. Frequent substitution: Replace the missing values with the most frequent item.
e. Improve the data collector: Your business folk will talk to the clients and inform them about why it is worth fixing the problem with the data collector.
Problem 5 – An empty row in the data
If you observe in the dataset, you can see that there is a Empty row. If you read this file with Pandas library, and look at the content of your dataframe, you have a empty row that has been filled with NaNs.See Fig 7
import pandas as pd df = pd.read_csv("patient_heart_rate.csv") print(df) |
There is no option to ignore the row in the function read_csv(), so we need to handle this using dropna() method as shown in below code.
df.dropna(how="all", inplace=True) |
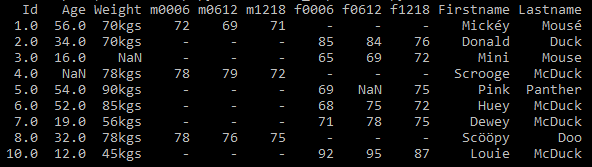
After executing this code, the empty row is removed. See Fig 8
Problem 6 – Duplicate records in the data
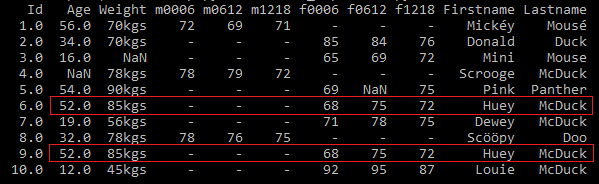
Sometimes, in the dataset there may be some duplicate records. In our dataset there is a record which is repeated in 6th and 9th rows. See Fig 9 for duplicate records.
import pandas as pd #Read the data set df = pd.read_csv("patient_heart_rate.csv") print (df) |
First, check if you have duplicate records. If duplicate records exist, then you can use the Pandas function drop_duplicates() to remove the duplicate records.
#Use drop_duplicates method to remove duplicate records. Using subset helps to consider certain columns for identifying duplicates. df = df.drop_duplicates(subset=['Firstname','Lastname']) print (df) |
Once this code is executed, the duplicate records get deleted. See Fig 10
Problem 7 – Non-ASCII characters
There are few non-ASCII characters in the Firstname and Lastname columns in the data. See Fig 11 below
There are multiple ways how you can handle non-ASCII characters. You can remove them, replace them with other characters, just post a warning, etc. In this example, we are removing them.
import pandas as pd df = pd.read_csv("patient_heart_rate.csv") df.Firstname.replace({r'[^\x00-\x7F]+':''}, regex=True, inplace=True) df.Lastname.replace({r'[^\x00-\x7F]+':''}, regex=True, inplace=True) print (df) |
After executing this code, the non-ASCII characters are replaced with blank. See Fig 12 below
Problem 8 – Column headers are values and not variable names
The columns headers are composed of the values for Sex and Hour range variables for each individual row. Corresponding to each ‘m’ column for males, there is also an ‘f’ column for females, f0006, f0612 and so on as shown in the Fig 13.
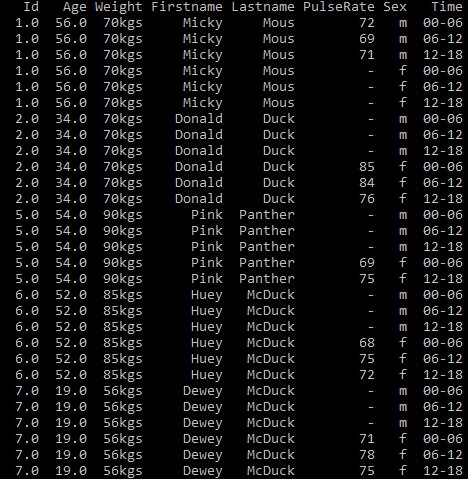
A tidy version of this dataset is one in which we need to remove the different values from the header and unpivot them into rows. Here, the Sex and Hour range would not be columns headers but rather row values in Sex and Time columns. In order to tidy this dataset, we need to “melt” the data. We’ll first “melt” the Sex + Hour Range columns into a single one. The pandas library has a built-in function that allows doing just that. It “unpivots” a DataFrame from a wide format to a long format. Once we have that single column, we’ll derive three columns from it: sex, time_lower and time_upper. With those, we’ll be able to build a tidy dataset.
#Melt the Sex + time range columns in single column df = pd.melt(df,id_vars=['Id','Age','Weight','Firstname','Lastname'], value_name="PulseRate",var_name="sex_and_time").sort_values(['Id','Age','Weight','Firstname','Lastname']) # Extract Sex, Hour lower bound and Hour upper bound group tmp_df = df["sex_and_time"].str.extract("(\D)(\d+)(\d{2})",expand=True) # Name columns tmp_df.columns = ["Sex", "hours_lower", "hours_upper"] # Create Time column based on "hours_lower" and "hours_upper" columns tmp_df["Time"] = tmp_df["hours_lower"] + "-" + tmp_df["hours_upper"] # Merge df = pd.concat([df, tmp_df], axis=1) # Drop unnecessary columns and rows df = df.drop(['sex_and_time','hours_lower','hours_upper'], axis=1) df = df.dropna() df.to_csv('outputcleanup.csv',index=False) print (df.head()) |
Once you execute the above code, the data looks like this
Fig.14 shows the results of melting the patient_heart_rate dataset with row values in Sex and Time columns.

Fig.15 shows the results of splitting the single column into two real variables: Time and Sex
Problems I have not covered
There were two important and common problems that I could not do justice in this already long post:
a) handling dates
b) correcting character encodings (a problem you hit when you scrape data off the web)
I want to cover them as part of a new post on data scraping. If you hit these problems, before I publish my other post, I’d encourage you to Google about them.
In this post, you have got the essence of tidying data using Python Pandas. Data cleaning is not a glamorous job but is critical in data-intensive applications. I hope I have convinced you, the tester, that it is not so scary. Depending on your requirements and analysis you can tidy your data with simple methods as shown in this post.
If you are a startup finding it hard to hire technical QA engineers, learn more about Qxf2 Services.
References:
I stongly recommend you spend some time on the references below. I learnt so much from them!
1. Tidy data: Read this paper if you are serious about testing. The entire Qxf2 team highly, highly recommends it.
2. Engineering data analysis: This is an excellent talk on data and how it can be used. Talk is by the author of the tidy data paper.
3. Tidy data and Python: The tidy data paper was written with R snippets. This post is for Pythonistas.
4. Data cleansing: Wiki has good thoughts on what are attributes of high quality data

I am an experienced engineer who has worked with top IT firms in India, gaining valuable expertise in software development and testing. My journey in QA began at Dell, where I focused on the manufacturing domain. This experience provided me with a strong foundation in quality assurance practices and processes.
I joined Qxf2 in 2016, where I continued to refine my skills, enhancing my proficiency in Python. I also expanded my skill set to include JavaScript, gaining hands-on experience and even build frameworks from scratch using TestCafe. Throughout my journey at Qxf2, I have had the opportunity to work on diverse technologies and platforms which includes working on powerful data validation framework like Great Expectations, AI tools like Whisper AI, and developed expertise in various web scraping techniques. I recently started exploring Rust. I enjoy working with variety of tools and sharing my experiences through blogging.
My interests are vegetable gardening using organic methods, listening to music and reading books.


How do i run the above in idle? I ran and i get the following error > RESTART: C:/Users/evans/Desktop/python-data-cleaning-blogpost-master/clean.py
Hi
You can run using IDLE by copying individual code snippet or you can use command prompt to run the code. What piece of code are you trying to execute? Can you provide more details about the error messages to find out why you are getting this.
Thanks,
Indira Nellutla
HI
please place cleaned data set for download .
THANK YOU
Hi, you can download the cleaned data set from https://github.com/qxf2/python-data-cleaning-blogpost
Thanks
Indira Nellutla
very nice tutorial with good references. I used the provided data set and have a problem that>
df[[‘first name’,’last name’]].duplicated(keep = False)
shows the duplicates. But if I use df.duplicated(), i only get False and no True.
Do you know why it is so?
Hi,
1) df.duplicated() checks if the whole row appears elsewhere with the same values in each column of the Dataframe. In our example dataset, the ‘Id’ column is not duplicated, hence when you do df.duplicated() it just returns False.
2) The statement which you provided ‘df[[‘first name’,’last name’]].duplicated(keep = False)’ checks if there are duplicate values in a particular column(in this case ‘first name’ and ‘last name’) of the DataFrame. In our example dataset, since ‘last name’ and ‘first name’ are duplicated it returned True.
I hope this helps.
Thank you so much, you have made it quiet easy for beginners to understand.
This is a good post explaining the basics of data cleansing.