Evaluating machine learning models is crucial for understanding their performance characteristics. In this blog post, we explore how ROC and Precision Recall curves can be used to improve the way we evaluate models. Additionally, we delve into the practical aspect of using these curves across various thresholds, customizing the model for specific requirements and achieving optimal performance.
Why this post
Understanding how to evaluate machine learning models is crucial for a technical tester. The evaluation metrics give you one more way to assess the model’s quality. Further, they help you decide if changes to the model made things better or worse. While data analysts and other stakeholders play a major role here, having a tester’s viewpoint adds valuable insights to the process. This blog post aims to empower testers by providing insights into model evaluation details. At Qxf2 Services, we emphasize the importance of continuous learning and technical expertise. This knowledge will enable testers to actively engage in discussions related to model evaluation and selection.
Problem
In one of our previous blog posts we built a comment classification model. We relied on the model’s predictions for decision-making. Additionally, within the Model Evaluation section, we explored the use of precision, recall, and F1 scores.
Then, we began exploring ROC and Precision Recall curves. Our focus shifted towards considering prediction probabilities. Rather than relying solely on binary true or false model predictions, we aimed to express decisions based on the model’s level of confidence.
Learning to integrate thresholds into these probabilities provides valuable insights into enhancing precision, recalibrating false positive rates, and fine-tuning true positive rates to align with our application’s specific requirements. While our focus remains on the application of the ROC curve in this exploration, we will also touch upon the application of Precision-Recall curve to offer a glimpse into its potential contributions to our understanding of model performance.
Precision Recall curve
Precision, Recall, and F1 score are metrics for a specific threshold used for evaluating classification models. This provides insights into different aspects of model performance. Whereas the Precision-Recall curve provides a comprehensive view of model performance across various thresholds. It provides a graphical representation of how precision and recall change as we vary the classification threshold. This curve is particularly useful when the dataset is imbalanced, where the positive class is significantly less frequent than the negative class. It aids in selecting an optimal threshold that aligns with the desired trade-off between precision and recall.
Now, let’s apply these concepts to our comment classification model using the Python code snippet below. The function generate_precision_recall_curve takes the true labels (y_test) and predicted probabilities (y_probs) as inputs, then computes precision, recall, and the area under the curve (AUC) for the Precision-Recall curve, providing a quantitative measure of the model’s performance in a binary classification scenario. The area under curve (AUC) is a common metric for summarising the performance of a model. A higher AUC indicates better performance.
def generate_precision_recall_curve(y_test, y_probs): """Generate Precision-Recall curve and calculate AUC.""" precision, recall, thresholds = precision_recall_curve(y_test, y_probs) pr_auc = auc(recall, precision) return precision, recall, pr_auc |
This function can be used to analyse and visualise how well our comment classification model performs across different threshold values, offering valuable insights for model optimisation.
ROC Curve:
The Receiver Operating Characteristic (ROC) curve is a crucial tool for evaluating classification model. It is important to note that the ROC curve may not be the most suitable metric for highly imbalanced datasets, where the positive class is significantly less frequent than the negative class. The reason is that the ROC curve depends on false positive rate (FPR) and true positive rate (TPR), in imbalanced settings, high true negative rates can overshadow the performance on the minority class.
Now, let’s apply these concepts to our comment classification model using the Python code snippet below. The function generate_roc_curve takes the true labels (y_test) and predicted probabilities (y_probs) as inputs, then computes the false positive rate, true positive rate, and the area under the curve (AUC) for the ROC curve, providing a quantitative measure of the model’s discriminative ability.
def generate_roc_curve(y_test, y_probs): """Generate ROC curve and calculate AUC.""" fpr, tpr, thresholds = roc_curve(y_test, y_probs) roc_auc = auc(fpr, tpr) return fpr, tpr, thresholds, roc_auc |
This function can be used to analyze and visualize how well our comment classification model performs across different threshold values, offering valuable insights for model optimization.
Plotting the curve
We created plot_curve and plot_roc_and_pr_curves functions to leverage the matplotlib.pyplot module to generate visualizations of either the ROC or Precision-Recall curves. These functions provide a quick and effective way to visualize the performance metrics derived from classification models.
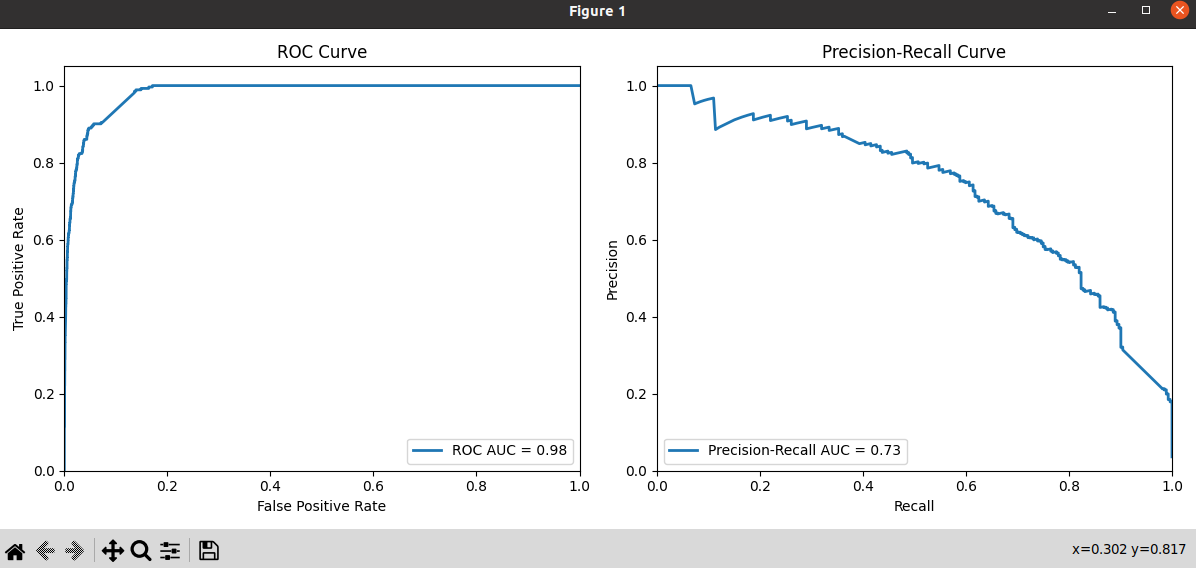
The ROC Curve shows the True Positive Rate (TPR) on the y-axis against the False Positive Rate (FPR) on the x-axis. A good ROC curve has a high TPR for all FPR values, meaning it correctly identifies most positive cases while minimizing false positives. Also a plateau observed in the ROC curve around a False Positive Rate of ~0.15 suggests that, beyond this point, the model’s ability to discriminate between true negatives and false positives reaches a saturation point.
The Precision Recall curve shows Precision on the y-axis against Recall on the x-axis. A good precision-recall curve has high precision for all recall values, meaning the model is precise in its predictions of positive cases while missing as few real positives as possible. The Precision-Recall curve may go up and down because changing the threshold affects both precision and recall differently. Improving one metric may harm the other, and it depends on where we set the threshold. This helps us understand the trade-offs between precision and recall at various thresholds.
Selecting the right Threshold
By analysing the graph, we gain the ability to choose an appropriate threshold tailored to the specific requirements of the application under evaluation. If the priority is to minimize the False Positive Rate or maximize the True Positive Rate, it becomes essential to engage in discussions with the Product team to determine the threshold that aligns with the desired outcomes for the application.
Similarly, when examining the Precision-Recall Curve (PRC), the choice of a metric with high precision or recall depends on the specific goals of the application. It’s worth noting that achieving both high precision and recall simultaneously can be challenging due to the inherent trade-off between these metrics.
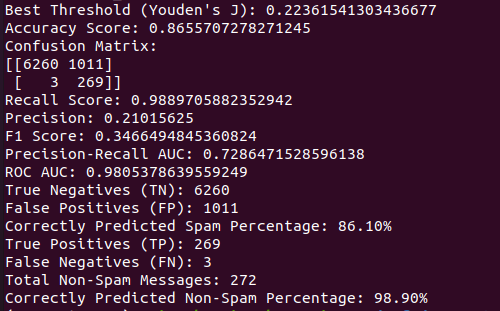
In the context of this example, we have opted for the Youden’s J statistic as the selected threshold. This statistical measure provides a balanced approach by considering both sensitivity and specificity, making it a suitable choice for decision-making in classification tasks.
You can find the complete code example here
Conclusion
In conclusion, we’ve delved into the world of ROC and Precision-Recall curves to fine-tune our understanding of how our comment classification model performs. By adjusting thresholds and leveraging these powerful tools, we can enhance the model’s effectiveness for specific needs. This process empowers testers to understand machine learning better, improve settings, and make these technologies more practical in real-world situations. Stay tuned for more insights into the realm of machine learning and quality assurance!
Hire testers from Qxf2
A tester wrote this post. Surprised? Qxf2 has technical testers who go well beyond traditional test automation. We read technical papers, work with modern tooling and contribute to open source. So, if you are looking for technical testers for your project, get in touch with us.

I am a dedicated quality assurance professional with a true passion for ensuring product quality and driving efficient testing processes. Throughout my career, I have gained extensive expertise in various testing domains, showcasing my versatility in testing diverse applications such as CRM, Web, Mobile, Database, and Machine Learning-based applications. What sets me apart is my ability to develop robust test scripts, ensure comprehensive test coverage, and efficiently report defects. With experience in managing teams and leading testing-related activities, I foster collaboration and drive efficiency within projects. Proficient in tools like Selenium, Appium, Mechanize, Requests, Postman, Runscope, Gatling, Locust, Jenkins, CircleCI, Docker, and Grafana, I stay up-to-date with the latest advancements in the field to deliver exceptional software products. Outside of work, I find joy and inspiration in sports, maintaining a balanced lifestyle.