Debugging the code in Python is a bit tricky when compared to other programming languages. Most of us use print statements in the code at multiple places to print the variable values and figure out the problem. Or sometimes use time.sleep() statements to pause the python program to check what’s going on in the code. Recently we started tracing our code using pytest with Python Debugger(pdb). The main advantage is you can monitor the state of variables, stop and resume the flow of execution, set breakpoints etc. This post lets you understand how to use the Python debugger features with pytest options and inserting set_trace() statements inside your code.
This post uses our test_example_form.py as example to illustrate different pdb tracing features.
Using pytest to start pdb debugger
pytest by default comes with Python debugger support and allows to open the debugger pdb prompt(via a command line option) at the start of a test or when there are test failures. You can use different command options like l (list), a(args), n(next) etc., after entering into pdb prompt. To quit from the pdb prompt, simply press q(quit) and the ENTER key.
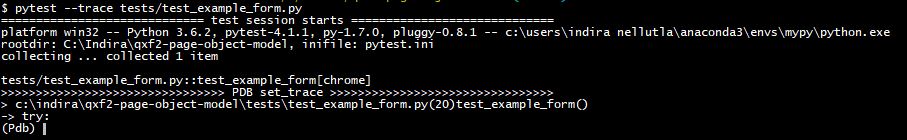
i) Enter into PDB prompt at the start of each test using –trace option
pytest --trace test_example_form.py |
This will invoke the Python debugger at the start of every test.
ii) Enter into PDB prompt on failures. This will invoke the Python debugger on every failure.
pytest --pdb test_example_form.py |
Using Python debugger within the code
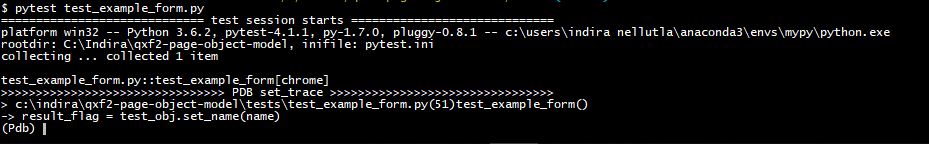
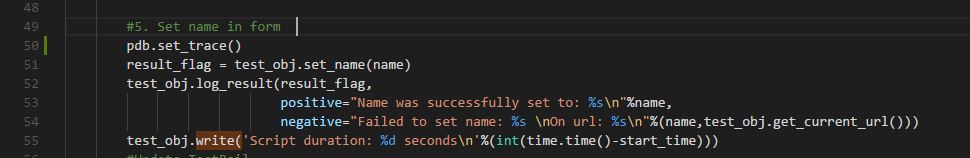
We can use pdb.set_trace() or pytest.set_trace() to invoke PDB debugger and tracing from within the code. When your code stumble across the line with pdb.set_trace() it will start tracing and you can see a pdb prompt in the command prompt. Instead of stepping over many lines of code, you can simply use a breakpoint where you want to debug. First, choose a place in your code where you want to start the debugger and simply insert below code. In our case, we placed this before set_name() method.
import pdb #5. Set name in form pdb.set_trace() result_flag = test_obj.set_name(name) |
Immediately when this line is executed, Python debugger starts a pdb prompt and waits for user instructions on the next steps in the interactive mode. Python 3.7 brings in a built-in function called breakpoint() which by default will import pdb and call pdb.set_trace()
There are several commands you can execute in the pdb prompt for debugging your code like monitoring the variables, setting breakpoints, executing code line by line, step into a function, etc., Below are few commands we have used. We will have a detailed look at all these commands in the coming sections
n(next) – step to the next line within the same function
s(step) – step to the next line in this function or called function
b(break) – set up new breakpoints without changing the code
p(print) – evaluate and print the value of an expression
c(continue) – continue execution and only stop when a breakpoint is encountered
unt(until) – continue execution until the line with a number greater than the current one is reached
q(quit) – quit the debugger/execution
Step over and Step into the code
For illustrating this, we are going to pair ‘n’ and ‘s’ commands. In our example, we made a few changes in the set_name() method in our Base_Page.py. As part of debugging, we placed the pdb.set_trace() before calling this method in our test script which is in line number 50. We want to inspect the returned value result_flag from the set_name() method.
So, the execution stops at next line 51 where the function call is made. Now we used ‘s’ command to step into the function set_name(). So to brief, n(next) command executes until the next line and will not stop even when it encounters another function call. Where as s(step) command executes the current line and steps into the called function.
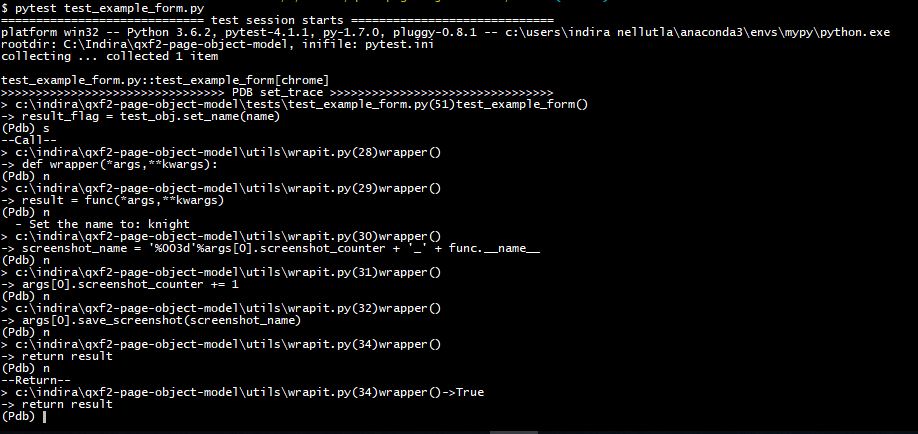
You will notice the line –Call– after the ‘s’ command to tell users that a call has been made to the function. When the end of the function is reached its prints –Return– along with the return value at the end. In our example, the function set_name() returned ‘True’ value and that’s what we see in the Return line. If you want to exit out of the called function and resume the steps you can use ‘r’ command from the pdb prompt.
Continue Execution
Once you have achieved the point where you think you need to stop debugging, you can use ‘c’ command to continue the flow of the execution. It continues to complete the flow of execution normally. It stops only when it encounters a breakpoint. Similarly, we have ‘unt’ command which is similar to ‘c’ command but it takes in line number argument if provided, will execute until it reaches a line number greater than or equal to the argument value.
Evaluate the variable values and expressions
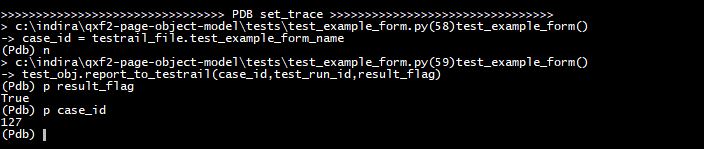
Often there will be instances where you might want to watch the variable returned by a function or method. You can achieve this by using the ‘p’ command. This command will evaluate the expression in the run time and print its value. In the above example, we want to evaluate the values of result_flag and case_id, we can use ‘p result_flag’ and ‘p case_id’ as shown below
Setting up new breakpoints without changing the code
You can use ‘b(reak)’ command to set a breakpoint without having to change your code. You can pass the Line number argument or function argument as shown below.
b(reak) [[filename:]lineno | function[, condition]] |
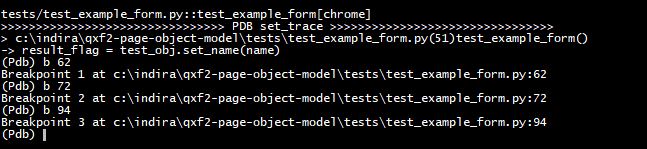
Line number argument without a filename prefix will set a breakpoint in the current file. If the line numbers argument is prefixed with a filename then a breakpoint will be set in the file specified( the file will be searched in sys.path). We will now see how it works with the line numbers option. In the below example, we are setting three breakpoints at different line numbers. We did not specify any filename here, so the breakpoint is set in the current file. Each breakpoint is assigned a number.
Below are few options used with b(reak)
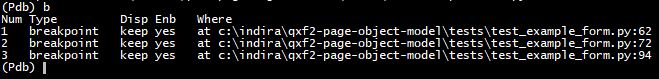
i) List all breakpoints
ii) Enable and Disable breakpoints
enable breakpoint number disable breakpoint number |

iii) Delete a breakpoint in the code
cl breakpoint number |
This post covers a few basic and essential commands. There are many other commands that can be used in pdb python debugger. You can refer this link for pdb documentation.
References
1. Pytest usage and invocations
2. Debugging Python Applications with pdb
QA consultancy for startups by Qxf2
Qxf2 is dedicated to helping startups build reliable, scalable testing practices. Our team of technical testers offers a range of options, from automation to specialized consulting, all tailored to startup challenges. See how our startup-focused QA services can support your growth trajectory.

I am an experienced engineer who has worked with top IT firms in India, gaining valuable expertise in software development and testing. My journey in QA began at Dell, where I focused on the manufacturing domain. This experience provided me with a strong foundation in quality assurance practices and processes.
I joined Qxf2 in 2016, where I continued to refine my skills, enhancing my proficiency in Python. I also expanded my skill set to include JavaScript, gaining hands-on experience and even build frameworks from scratch using TestCafe. Throughout my journey at Qxf2, I have had the opportunity to work on diverse technologies and platforms which includes working on powerful data validation framework like Great Expectations, AI tools like Whisper AI, and developed expertise in various web scraping techniques. I recently started exploring Rust. I enjoy working with variety of tools and sharing my experiences through blogging.
My interests are vegetable gardening using organic methods, listening to music and reading books.


You should check out Pysnooper 🙂 ! It’s a great little debugger tool.
Hi,
Thank you. We came to know about it recently on Hacker News too.
We will check the tool out.