Testing these days spills onto production too. Testers from Qxf2 have been able to show value by knowing how to trace transactions across multiple forensic tools. This post is for testers who have always wanted some insight into how to investigate issues in production but never had the opportunity.
Background
Testing in production also is a good idea. We were uncomfortable about the idea when this article came out. But that was because we were pretty inexperienced at testing loosely coupled microservices. After having wrestled with these systems over the last 2-3 years, we wholeheartedly embraced the concept of testing in production also. These are habits that are easy enough to pick up once you have the opportunity. But most testers rarely get the opportunity to learn about such practices. So, we simulated a story for this post using one of our internal applications. Testers interested in this kind of detective work can follow along.
The Problem:
At Qxf2, we use the Newsletter Automation Application to streamline the process of sending out newsletters to our subscribers. The application is built using Python Flask and uses a MySQL database. This app allows users to create new articles and add details such as the article title, description, and estimated reading time for inclusion in the newsletter. However, recently, we encountered an issue , where a user reported that they couldn’t find the articles they had added. This was a major concern for our team as it threatened the integrity of our newsletter distribution process. In response, we employed a range of forensic tools that we had set up to monitor the application to investigate the issue. In this post, we will detail the steps we took to identify and troubleshoot the problem
Forensic tools used to monitor the application:
As a software testing firm, Qxf2 often uses a range of tools to ensure the quality of the software. Our in-house Newsletter Automation Application is no exception this. We have set up a number of tools to analyze and monitor the application. Some of these tools included:
-
1. Debezium: Debezium is an open-source tool that helps you capture changes in your database. Essentially, it’s like having a camera on your database, recording everything that happens so you can easily track down issues when they arise. With Debezium, you can quickly identify what changed, when it changed, making it a super useful change data capture tool .
2. Kafdrop: Kafdrop is a cool tool used to view data stored in Kafka in a readable format. It’s like a magic window that allows you to see Kafka messages and inspect their contents without having to write code.
3. Prometheus: Prometheus is a software that helps monitor metrics from different systems. It’s commonly used to keep track of the health and performance of various applications. For our application, we have Prometheus setup to monitor Debezium metrics that captures the data changes in the newsletter automation database.
4. Grafana: Grafana is an open source tool that can visualize data in a way that’s easy to understand. It can take data from various sources like Prometheus, MySQL etc. and display it as charts or graphs. We have setup Grafana for the newsletter automation project and configured it with the Prometheus data source that monitors metrics from Debezium.
5. AWS CloudWatch: CloudWatch is a monitoring and logging service provided by Amazon Web Services. Basically, it lets you keep track of your AWS applications in real-time.
Thanks to these tools, we were able to resolve the issue and get to the root cause of the problem efficiently.
Verifying the addition of articles through CloudWatch
As the first step in investigating this issue, we wanted to make sure that the articles were indeed added to the database.
-
1. At Qxf2, a Skype listener passes messages to a (AWS) Lambda that extracts URLs from the messages if they are present. The lambda then stores the extracted URLs in the Newsletter automation database.
2. In order to validate the user’s claim that the articles were added, we examined logs from AWS CloudWatch to check if the lambda had picked up the articles.
3. In our case, The user had reported missing two articles with URL’s https://levelup.gitconnected.com/rust-unit-testing-in-a-nutshell-aaa053ed425a and https://sdtimes.com/test/ai-in-api-and-ui-software-test-automation, which they had claimed to have added on March 7, 2023.
4. Based on this information, We located the logs for the time frames specified by the user when they claimed they had added the articles.
5. We were able to see the articles processed by the lambda in the logs, confirming that the article URL was picked up by the lambda and saved in the newsletter automation database.

Using Grafana & Prometheus to identify the Delete Events
As the next step in our investigation, we analyzed the Grafana graph that keeps track of the DELETE events.
-
1. The graph is set up with the Prometheus datasource and runs following metrics query to track all the delete operations:
debezium_metrics_TotalNumberOfDeleteEventsSeen{context="streaming", instance="debezium:8080", job="debezium", name="dbserver1", plugin="mysql"} |
2. Using this graph, we were able to determine if any delete operations had taken place since the time the articles were added.
3. To track the delete operations, we filtered the graph by specifying a custom date range. The date range spanned from the date when the articles were added to the date they were reported missing.
4. By doing so, we were able to isolate all the delete operations that occurred within the given timeframe.

5. As you can see from the above image there were three delete operations recorded within the specified time period. Two of the delete operations took place at 2023-03-08 11:46 while another delete operation was performed on 2023-03-08 13:11
Next, we’ll see how further investigation was carried out to pinpoint the exact timestamps when the reported article where deleted.
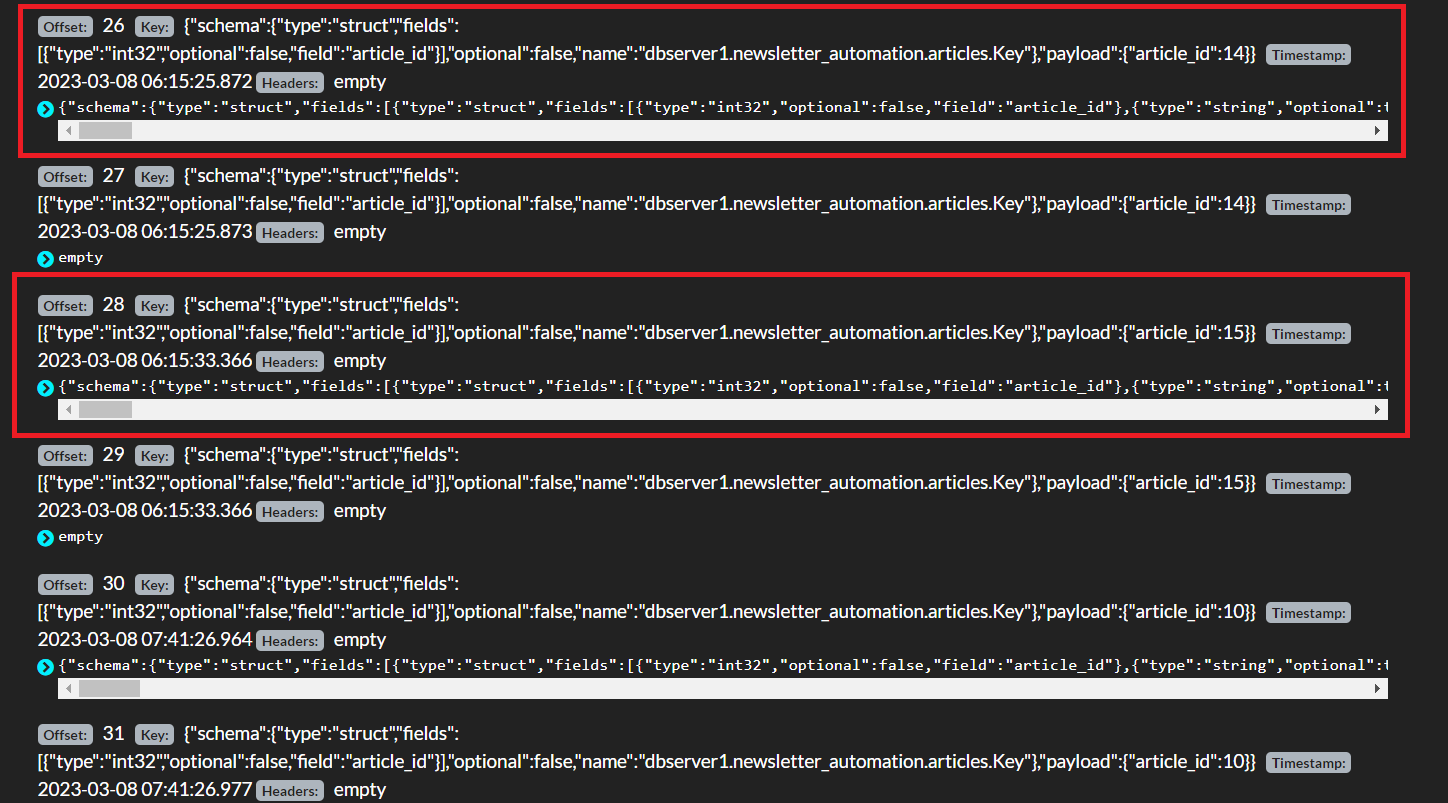
Verifying the delete operations with Kafdrop
We need a way to visualize the change data captured by Debezium, right?. To solve this , we have set up Kafdrop with the newsletter application to view and analyze data changes captured by Debezium.
-
1. After analyzing the delete events graph in Grafana and visualizing the change data in Kafdrop, we cross-checked the timestamps of the delete operations. This allowed us to pinpoint the exact time when the articles were deleted and obtain the before and after data.
2. However, since Kafka Streams only support UTC timestamps, we first had to convert the timestamps fetched from Grafana to UTC time. Therefore in our case, the UTC time stamps of the delete operations were 2023-03-08 06:15 and 2023-03-08 07:41, respectively.
3. By analyzing the data that was changed during these timestamps, we figured out that both the intended articles were deleted simultaneously one after the other at UTC 2023-03-08 06:15.
Following this, we are also able to look at the actual data that was deleted.
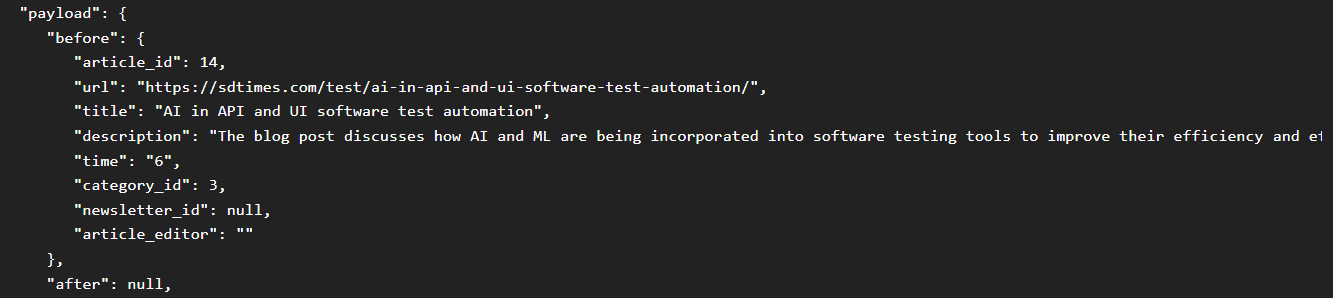
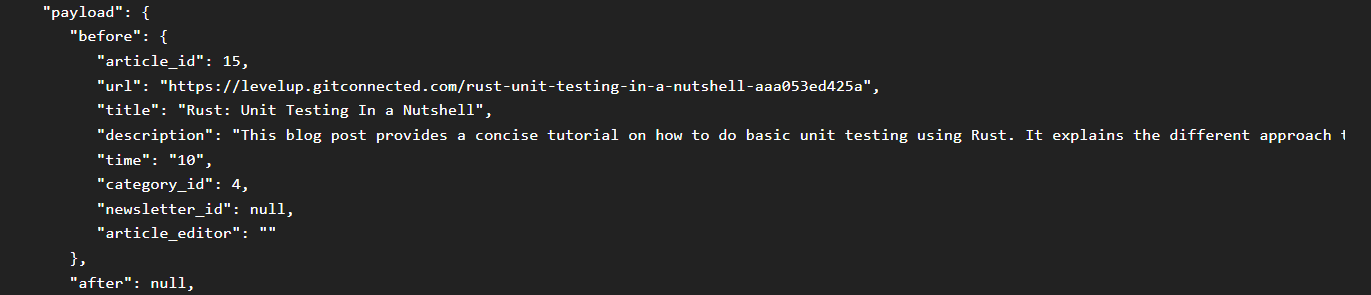
Viewing the Deleted Data
Now that we confirmed the timestamps of the delete operations, we wanted to look at the actual data record that was removed too.
-
1. Fortunately, Debezium stores both the before and after data for each change, so we were easily able to look at the data before the change was made to it.
2. In addition, Kafdrop also helped us by formatting this data in a well-readable form. By expanding the Kafka messages in Kafdrop ,we were able to see the data before changes were made.
Finally, to wrap up our investigation, we had to find out how the articles got deleted.
Finding the Culprit:
We had to find whether the deletion was manually performed by a user, or if the test suite for the newsletter automation application was responsible for removing the articles.
-
1. To determine the source of the delete operation, we revisited the AWS Cloudwatch logs to investigate the timeframe when the articles were deleted.
2. We know that the articles were deleted around the time 2023-03-08 11:46. So, We filtered the CloudWatch logs based on that timeframe.
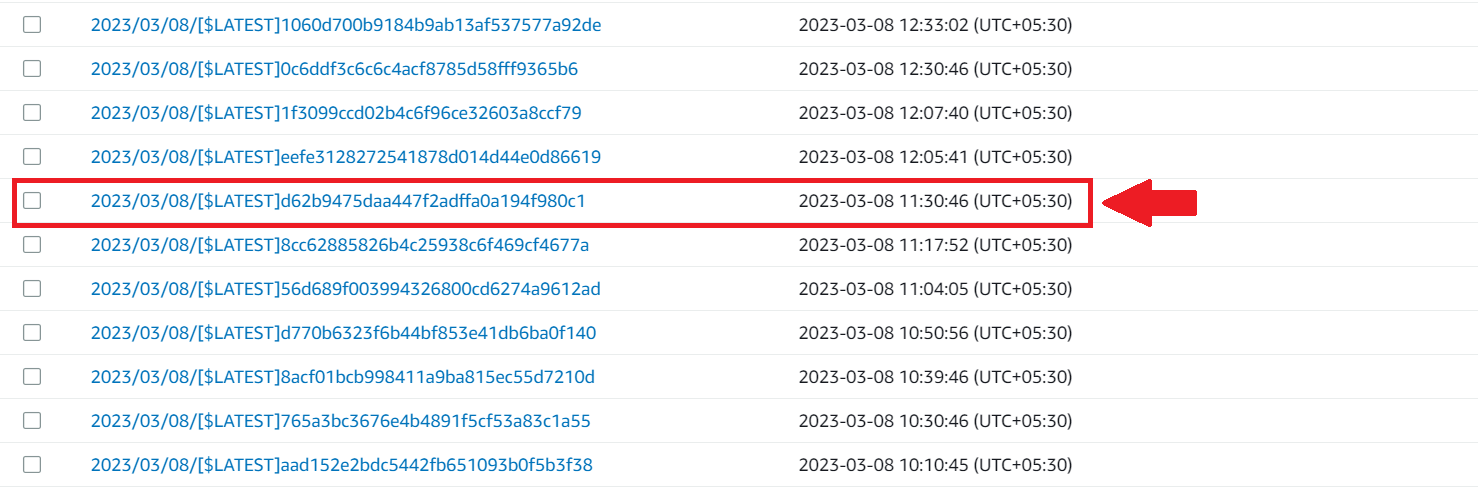
4. We then examined the log that was created at 2023-03-08 11:30, which can be seen the above image, to check if any article insertion step from the test suite had been executed. But we found none.
5. As a result, we were able to confirm that the test suite for the newsletter automation app was not responsible for the delete operation because none of the steps from the test suite to add new articles were executed at the time the articles were deleted.
This helped us to conclude that the delete was manually performed by a user.
Hire Qxf2: Modern testing for modern stacks
Qxf2 facilitates modern testing of modern stacks. Our versatile engineers excel at testing and love using tools. If you want technically inclined testers to join your project, reach out to Qxf2 via this simple form.

I am a QA Engineer. I completed my engineering in computer science and joined Qxf2 as an intern QA. During my internship, I got a thorough insight into software testing methodologies and practices. I later joined Qxf2 as a full-time employee after my internship period. I love automation testing and seek to learn more with new experiences and challenges. My hobbies are reading books, listening to music, playing chess and soccer.