Webform loading time depends on multiple factors such as hosting server, internet bandwidth, design of elements including type and number. As a tester, it is very difficult to find the root cause of the webform performance issue without using any tool. Using the HTTPwatch tool which is a simple extension to Google chrome, any tester can capture webform loading time very easily.
The summary logs will also show, which request has consumed more time in a group of requests. Another advantage of this tool is it will show how much time is taken by HTTP requests in seconds immediately, so not many complex calculations are required for the user to calculate response time for a particular request. All the logs can be saved in the CSV files and shared with the development team. Users do not need to set up a performance tool at the initial stage as well. Even some of the Surveys claim that form loads within `3 seconds`.
Installation:
1. Navigate to the website for downloading the setup.
2. Download the `Basic Edition` by clicking on the button `DOWNLOAD 25MB`. Setup will start downloading.
3. Click on the `httpwatch.exe` ->Right Click-> `Run as administrator` , following screen will open.
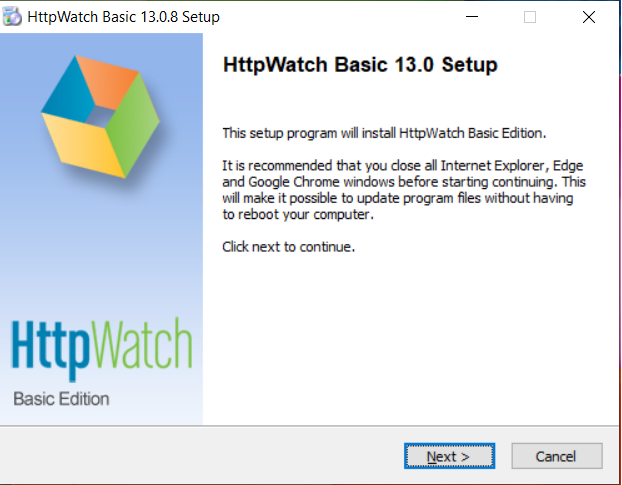
4. Click on `Next`, following screen will be open
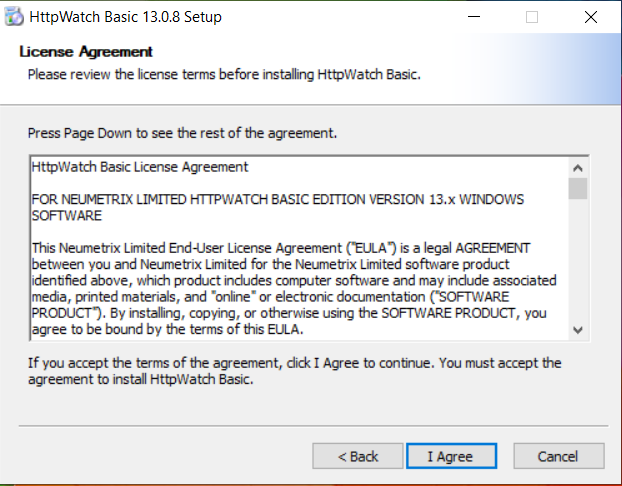
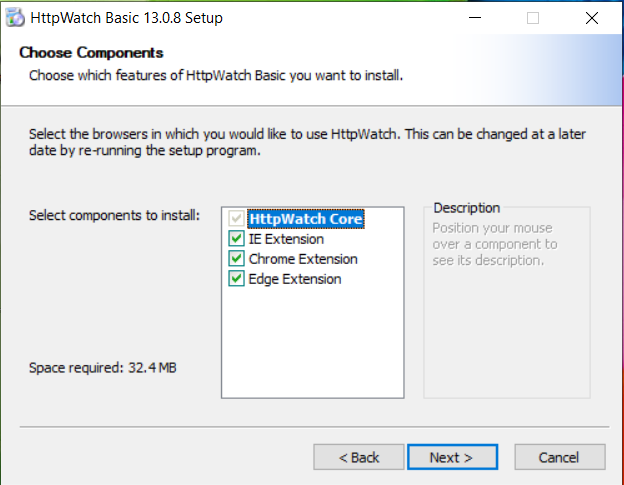
5. Click on `I Agree`, following screen will be open. Select the required components to be installed and then press `Next`
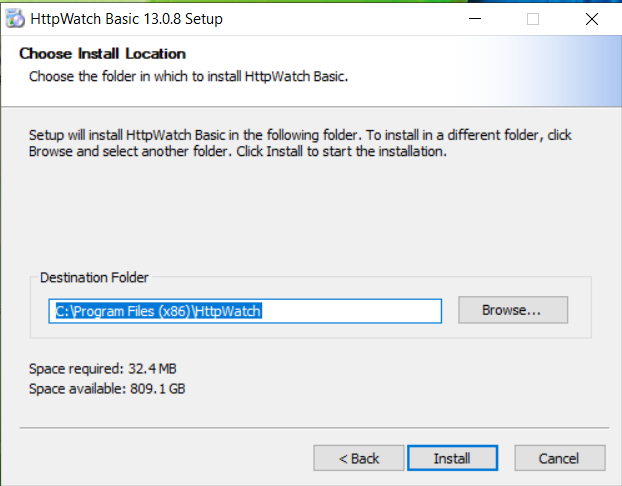
6. Select the `Destination Folder` in the below screen and then press `Install`
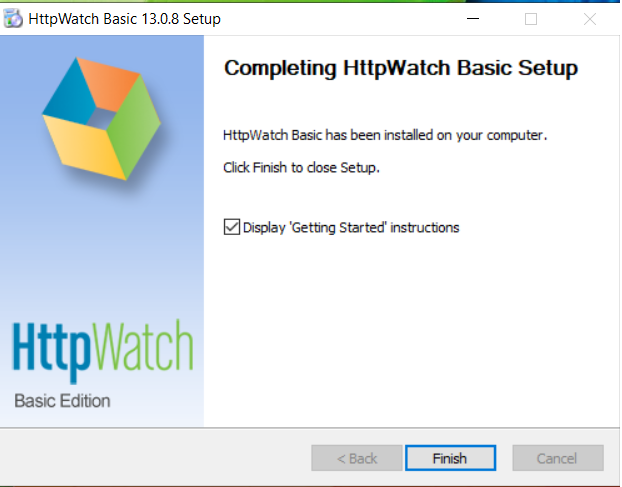
7. After completion of installation following screen will be displayed, click on `Finish`(Note- before clicking on finish setup will ask you to close all browsers, hence save all of your unsaved work)
8. Open the Chrome browser. `HTTPwatch` will be added as an extension in it.

HTTPWatch functionalities:
Note: Qxf2 Selenium Tutorial has been used to demonstrate the examples in the post.In the later section comparison between actual application will be covered. Although, We have demonstrated examples with Qxf2 Selenium Tutorial, We have tested this against publicly available websites like Facebook, LinkedIn, IRCTC, etc.
1. Open the application in this case Qxf2 Selenium Tutorial in the Chrome browser. Then click on the HTTPWatch icon and it will open the HTTPWatch console as shown in the below image.
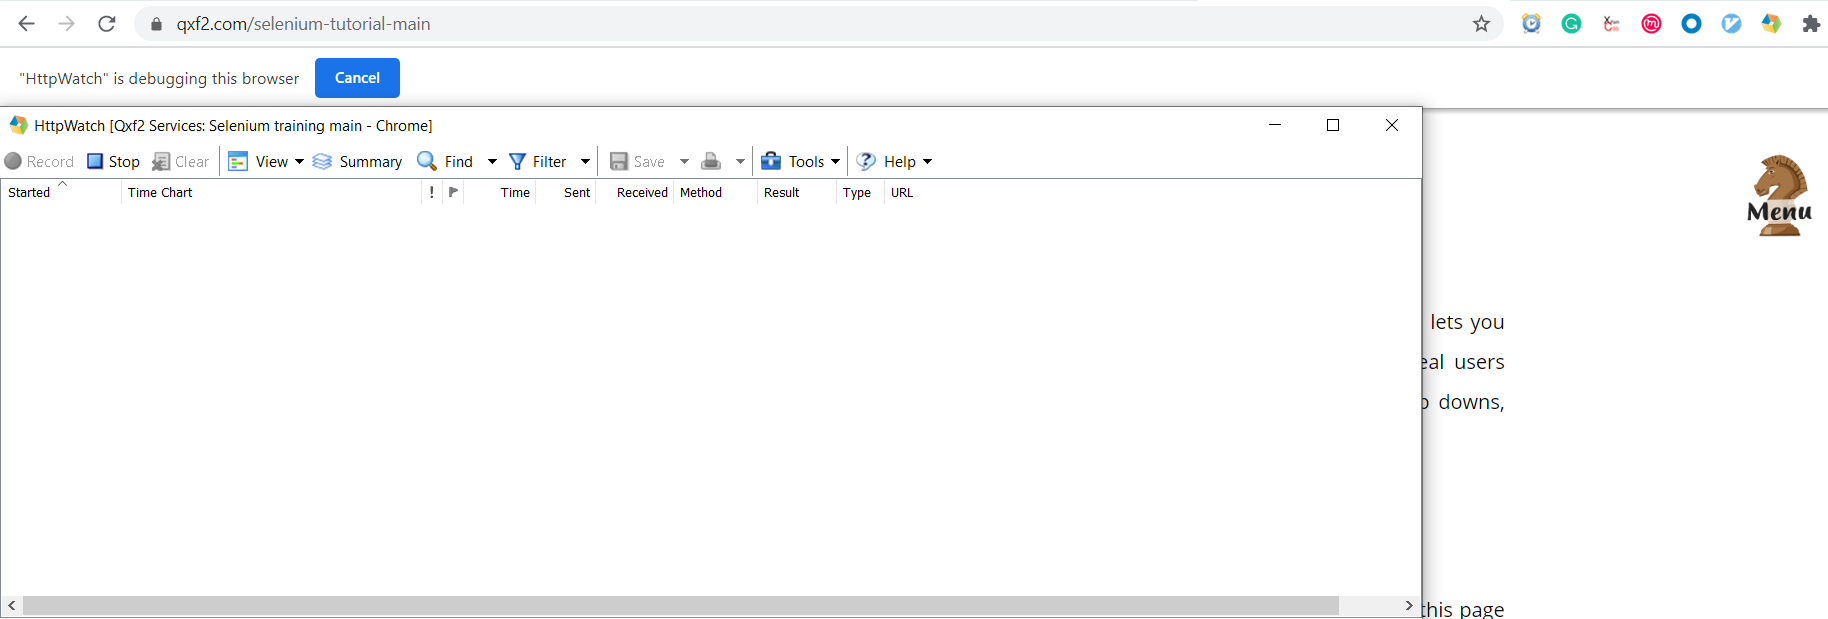
2. Close the `HTTPWatch is debugging this browser’s warning. The `Record` tab will be enabled to record the HTTP requests. Click on the `Record` tab the requests. Then access the webform in the open browser.

3. I have recorded the time capture for loading `Selenium-Redirect` form from the `selenium-tutorial-main-page` note that I have start recording after entering all details such as `Name`, `Email, `Phone No` and before pressing the `Click Me` button. Then open the HTTPWatch console to monitor the logs as shown in the below screen.
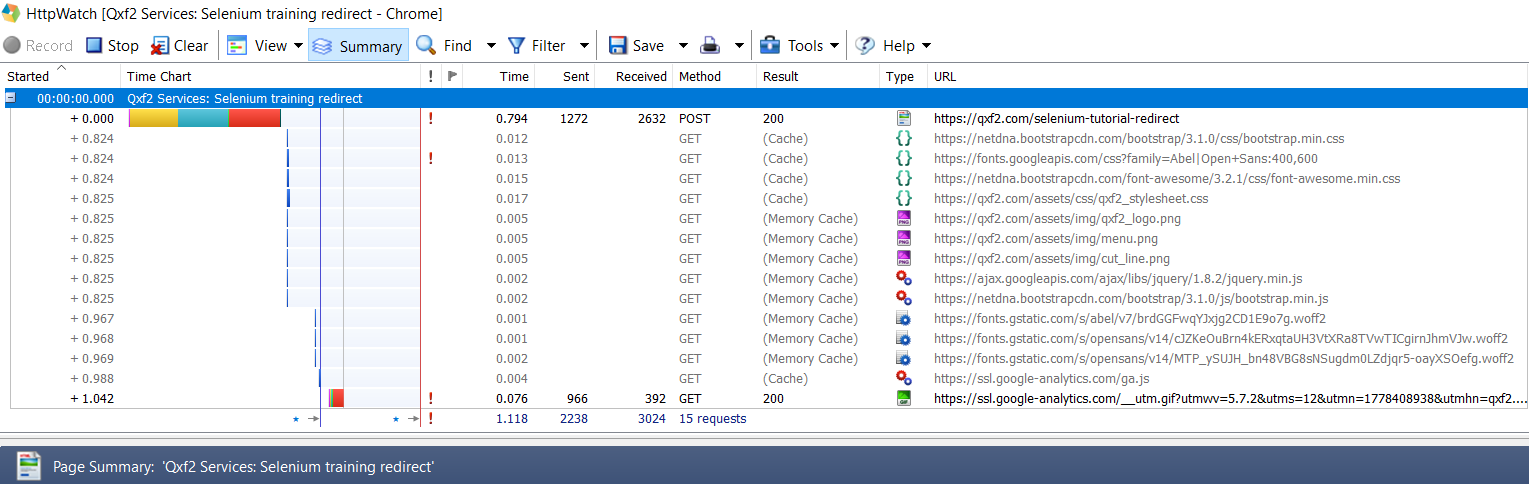
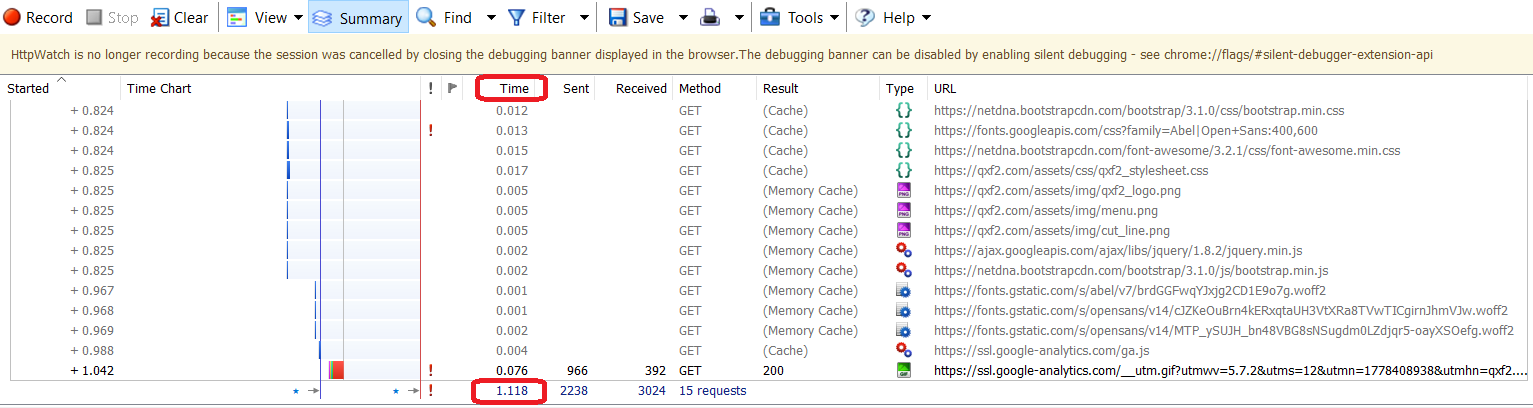
4. You can view the summary as shown below, the summary shows the `time taken for that particular scenario`(highlighted number in below image) i.e. `1.1` seconds, which is well within an acceptable range to open a form. Even I capture logs for all remaining pages and found that all forms open within 3 seconds. The summary will also show some of the parameters such as method `GET` or `POST`, as well as `status code` weather requests, got a response from `Cache` or `Memory Cache` etc.
You can use `Stop` to stop recording while, `Clear All` will clear all logs.
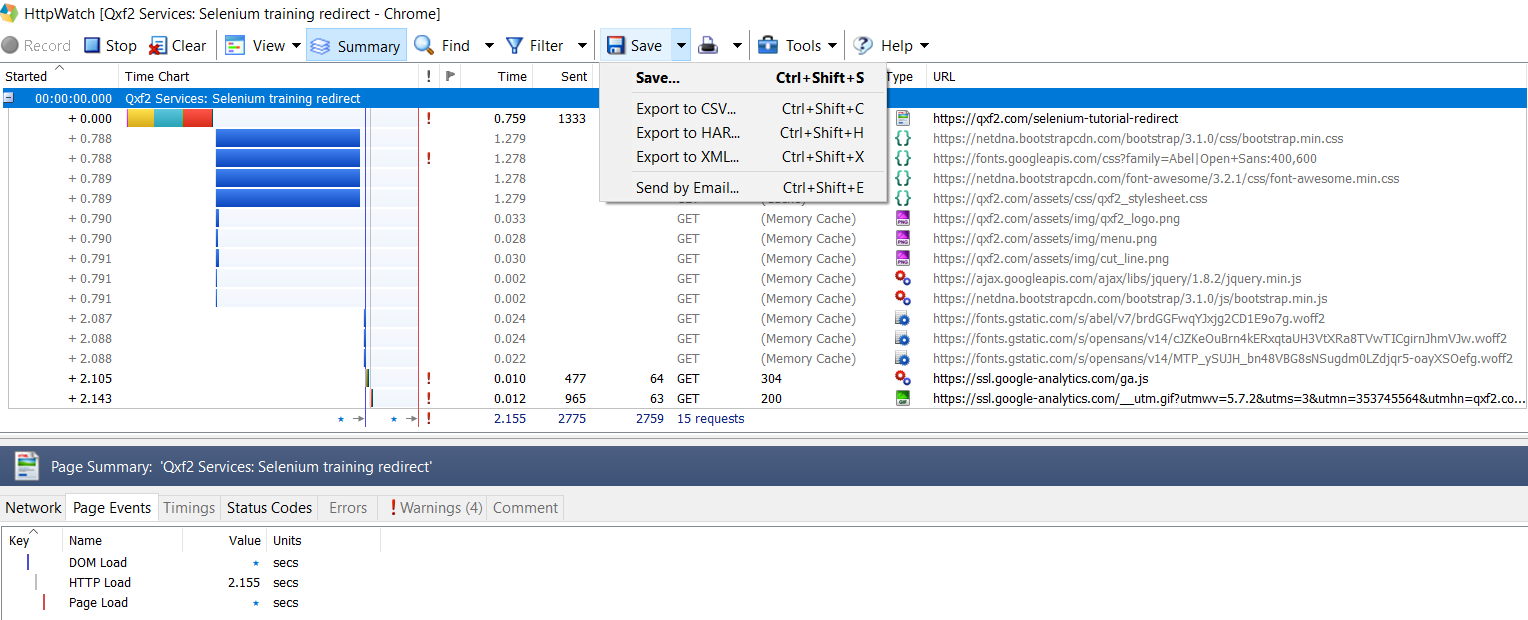
5. You can also `Save` these logs, as well as there are other options available such as `Export to CSV` and `Send by Email` as shown below:
I hope you have liked the blog. You can use this simple utility in your projects to capture form load times.

I have around 15 years of experience in Software Testing. I like tackling Software Testing problems and explore various tools and solutions that can solve those problems. On a personal front, I enjoy reading books during my leisure time.


Can you add a paragraph to give us an idea as to why this tool is better than the one (with similar feature?) built into the browser?
Which other specific tool are you talking about? We found HTTP watch simple to use and also with beautiful summary logs