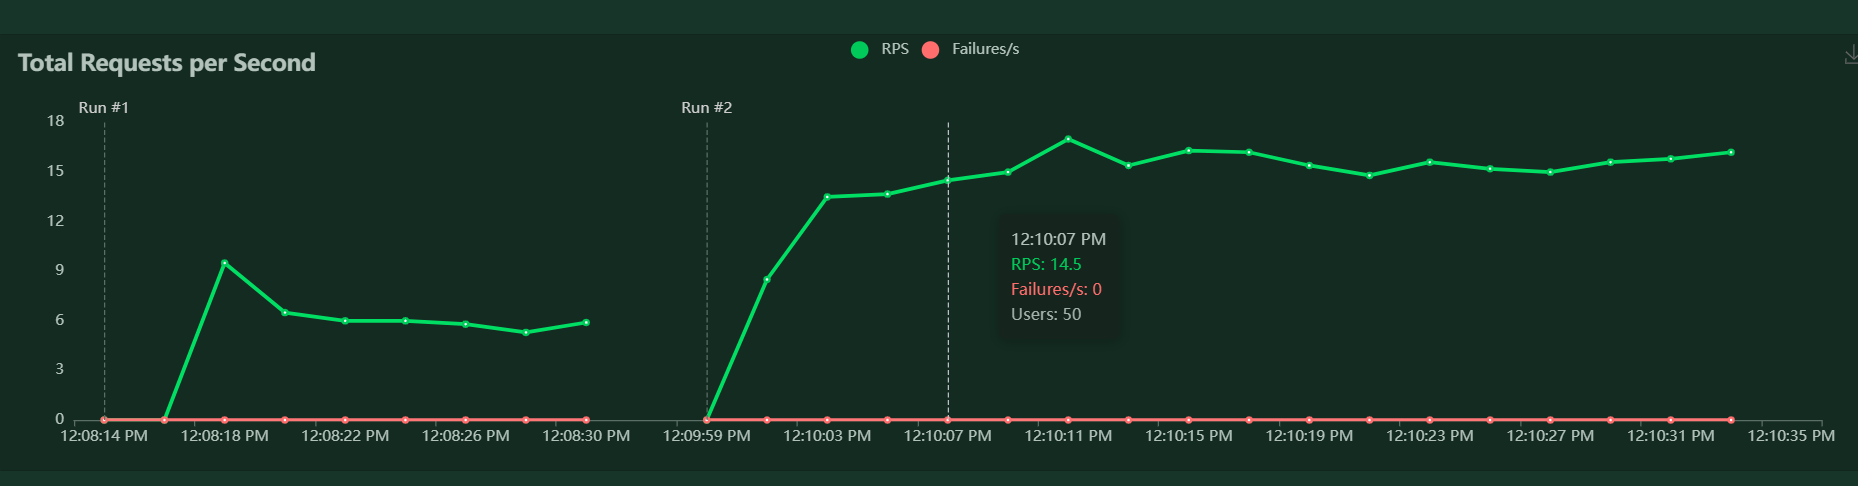
The image is a graph that shows the performance of the API endpoint when a load of 14.5 requests per second is given to the API endpoint using locust
Startup QA and test automation insights
The image is a graph that shows the performance of the API endpoint when a load of 14.5 requests per second is given to the API endpoint using locust
