This post will discuss how to improve your Exploratory Testing using Logmine. For sometime, I have been looking out for a log analyzer when I started doing exploratory testing with a new product. Logs are a gold mine of information if used well. You can infer common problems, get testing ideas, understand typical behaviour of a product and more from the logs. But typically, logs are thousands of lines long. Combing through them manually is nearly impossible unless you are already familiar with the product and its logs. We, at Qxf2, are technical testers and wanted a better way of analyzing the logs.
Now, there are several log analyzers available in the market like loggly which can do data visualization, data organization, anomaly detection etc. But as I mentioned earlier, we were more interested in technical depth and so our search for a suitable tool continued.
Using Logmine with Public system logs
Our search for a tool which would give first hand technical information came to an halt with logmine. Logmine is a log pattern analyzer CLI. We tried logmine on some of the openly available system logs and found the results were decent. The idea behind using open logs was to simulate an environment with new product where we don’t have any idea about the system and take logmine results help to understand the system and it’s problem.
Think about it. Isn’t this the way it works out in real time too? When we start with a new system to test, we hardly know it and want to gain more insights about it. I wanted to simulate this with logmine and tried with few logs.
Being a tester, I would like to understand and know from the logs what it is trying to tell me about the system, the problems it has encountered etc. It would give us a first hand information to dig deeper.
This is important while doing exploratory testing because, this phase mostly gives us a bird’s-eye view but we as testers need to go one more level deeper, behind the scene to understand the system as well as to uncover the errors. Logmine helps us achieve that.
I tried logmine with the following.
1. HealthApp
2. OpenStack
3. Proxifier
All of the above are available in loghub
I have picked up the 3 examples to demonstrate how logmine can give useful information most of the time but also sometimes the information might not be very useful for a tester. We will see all the scenarios in this post.
How to install and use logmine
To install logmine, you can simply do it with pip command.
pip install logmine |
To use logmine, you can concatenate the log file and use pipe (|) logmine.
cat HealthApp_2k.log | logmine |
The above will generate a output of log clusters with common patterns.
If you want to get more details, then you can create more granular clusters by adjusting the max distance (-m). Max distance represents the maximum distance between any log entry/message in a cluster and the cluster representative.
Below is an example of adjusting the max distance and creating more granular clusters.
cat HealthApp_2k.log | logmine -m0.2 |
Note: The lower the ‘m’ value, the more details you get.
In the next section, we will analyze 3 examples with logmine.
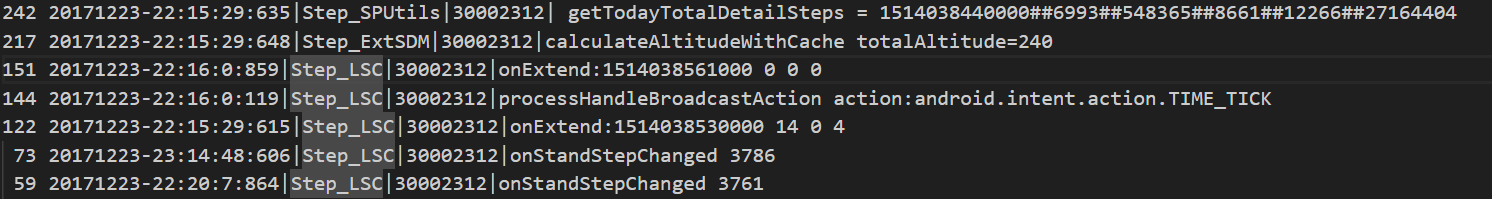
I. Analyzing HealthApp through logmine
HealthApp is an example where there is little information for testers to debug but useful information to understand the system.
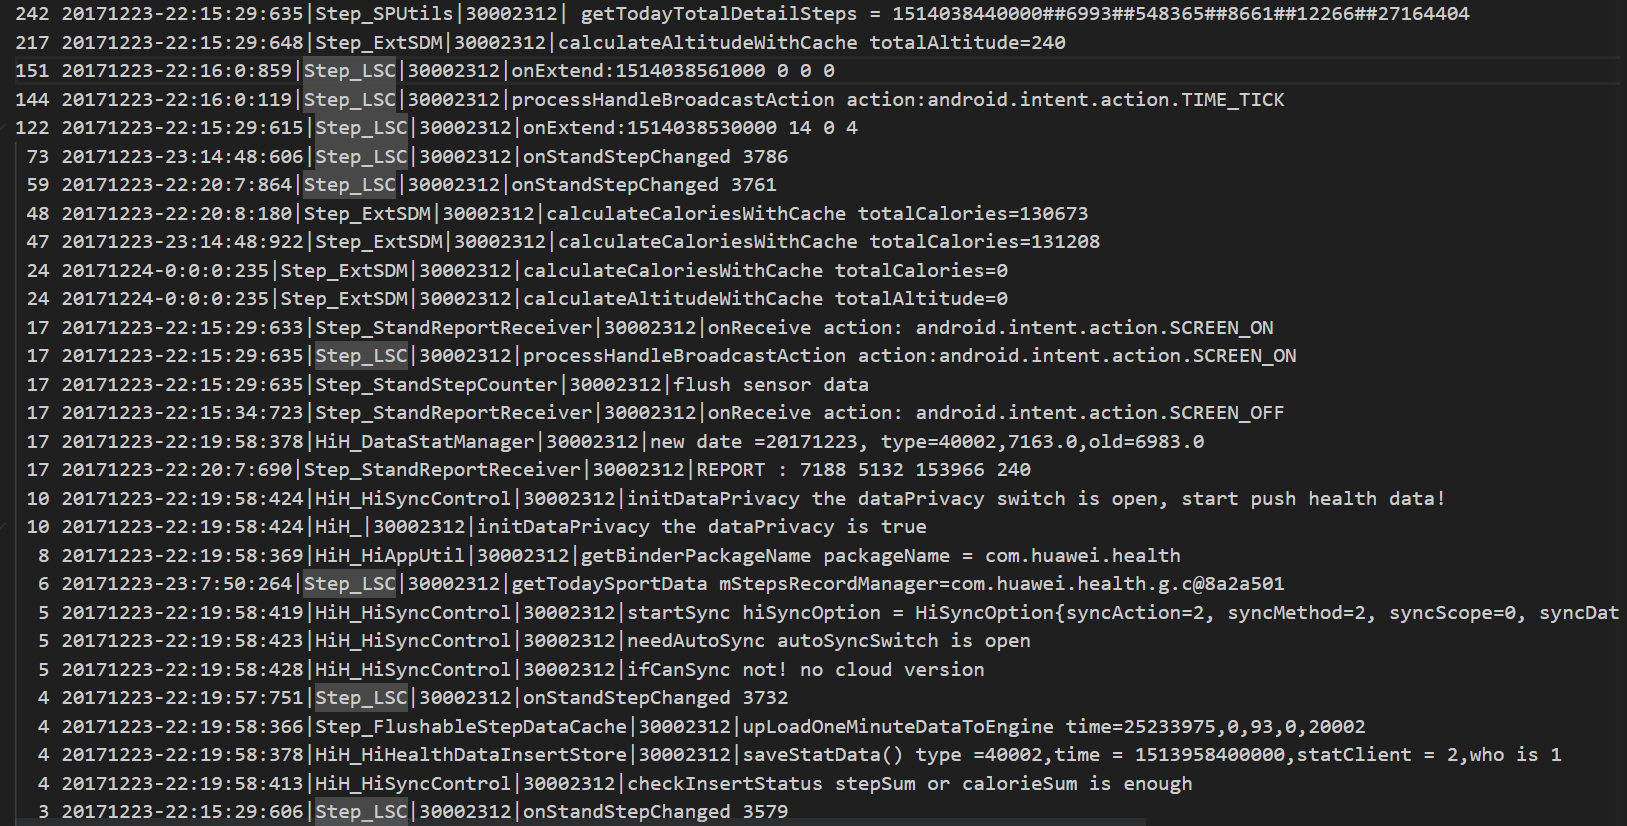
As you can see, the above snippet shows details of the system like Total detail steps, calculate altitude, total calories burned etc. but no data on any error. Being a tester, my eyes would look for places where some issue or error occurred so that I can dig deeper into the problem. So, this is an example where logmine is useful for providing system details but nothing specific to errors.
II. Analyzing Openstack
The next log, I analyzed was of Openstack. This was interesting because when I first tried logmine here, I was not happy with the result and I wanted to have more information. So, I tried using max distance here. Remember max distance (-m) from last section? and voila, it gave me a detailed log to debug.
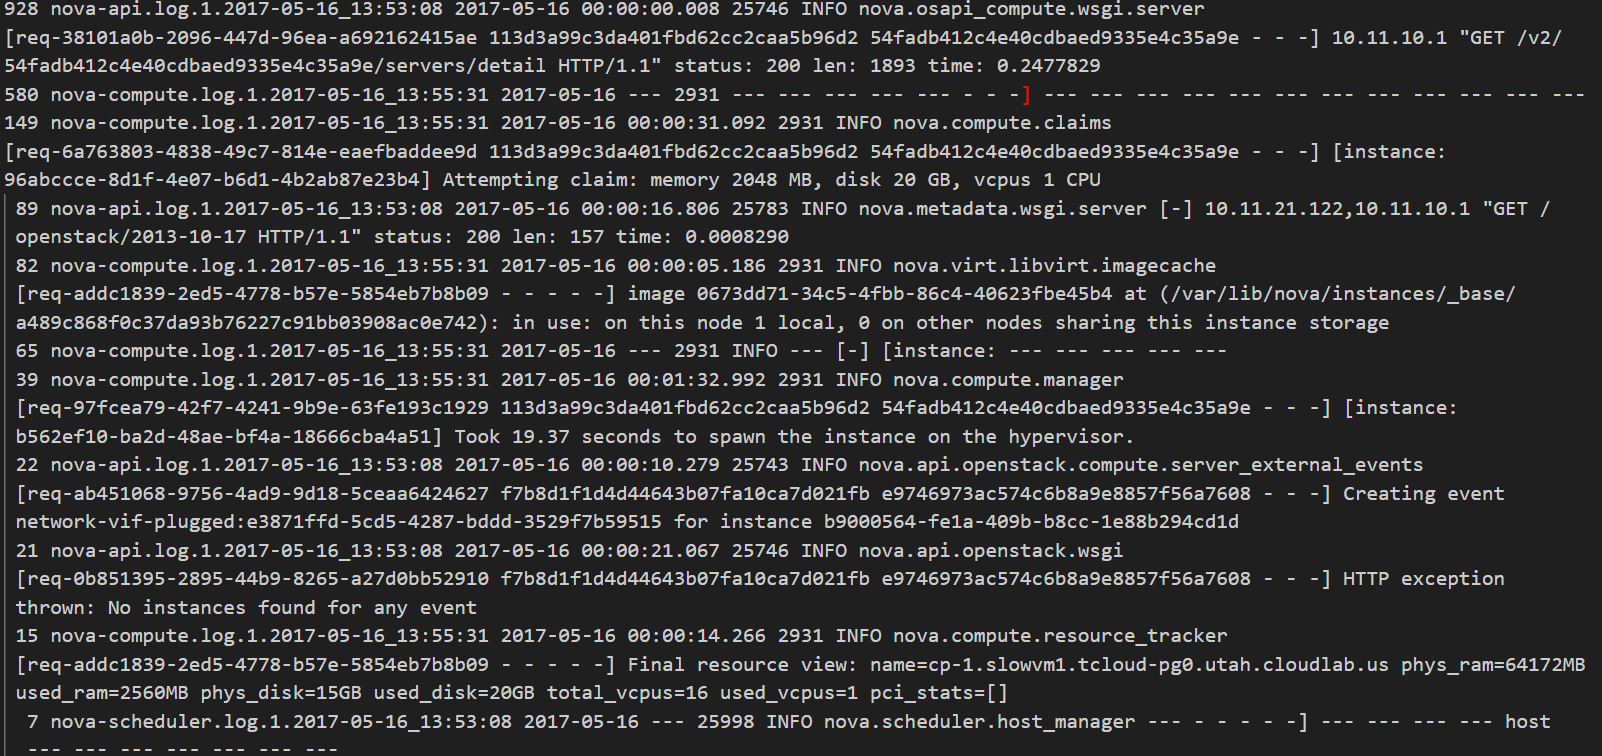
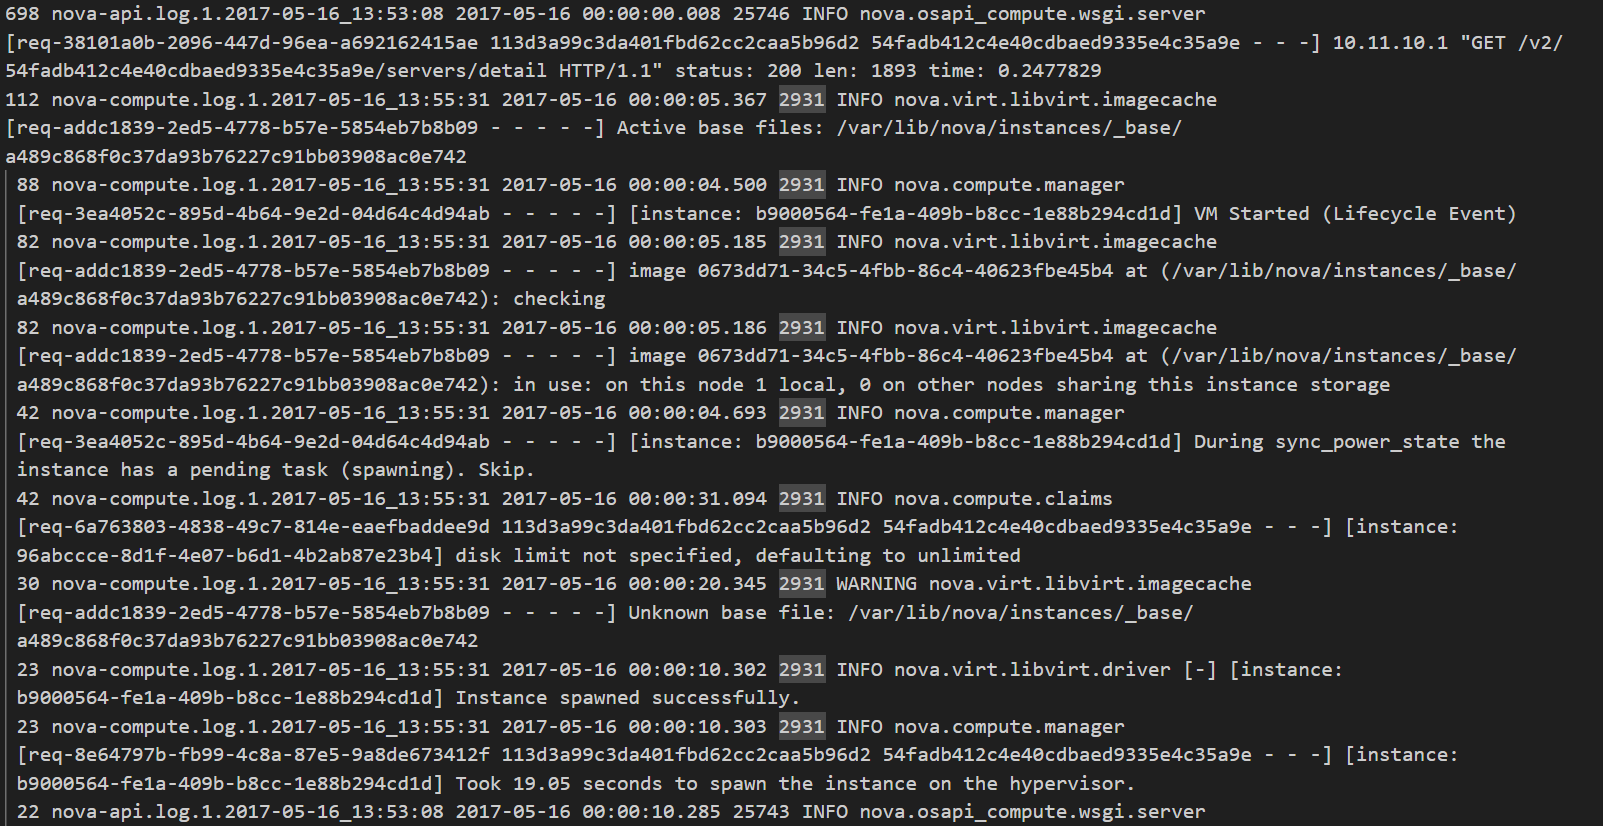
You can clearly see how at the beginning, the details were not thorough compared to when I used max distance.
Using detailed information helped here me understand the following:
1. The disk limit is not specified and hence it is defaulting to unlimited. Could there be an impact on system performance or resource availability?
2. 19.05 seconds taken to spawn the instance on the hypervisor. We have a scenario here to test for the duration taken? Is the time taken long? If so, why?
3. Similarly, 19.84 seconds taken to build instance, took 0.48 seconds to deallocate network for instance, took 1.11 seconds to destroy the instance on the hypervisor. Are these duration valid or are there any bottlenecks in network operations or resource deallocation?
These are few examples how as a tester, we can gain first hand information from logmine and then dig deeper to find the error as well as the cause.
III. Analyzing Proxifier
The last example I tried was with Proxifier. This is also another good example where testers have the needed information. Happy with the max distance output from above, I decided to apply it here as well.
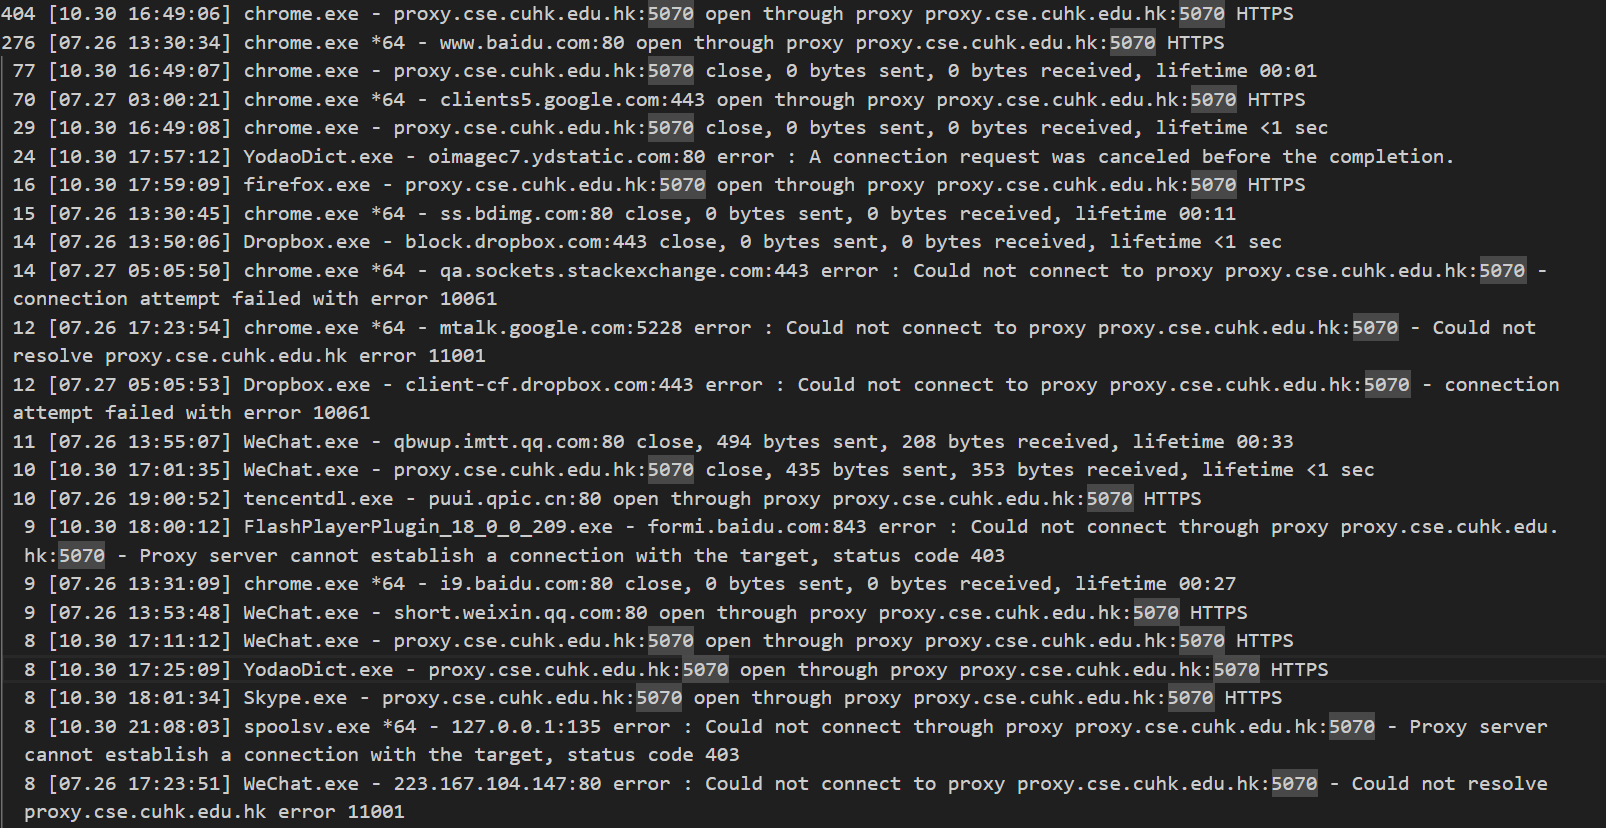
logmine helped to gain good insights here too. Specifically, there were two areas which I found helpful and would be a good point to start debugging more.
1. The logmine shows all the proxies opened.
We can verify if the applications are indeed configured to use the specified proxies. Next, we can attempt to establish connections through the proxies for each application and check if it is successfully established.
2. It also shows the error with error code.
We can check if the applications are correctly reporting errors when they encounter connectivity issues.
a. YodaoDict.exe – oimagec7.ydstatic.com:80 error : A connection request was canceled before the completion. This line gives me an idea for a test – kill the network connection in between a test.
b. qa.sockets.stackexchange.com:443 error : Could not connect to proxy proxy.cse.cuhk.edu.hk:5070 – connection attempt failed with error 10061 implies that the connection was refused. There can be several reasons why the connection was refused. Can I easily recreate a few such scenarios and see if the application failed gracefully?
c. mtalk.google.com:5228 error : Could not connect to proxy proxy.cse.cuhk.edu.hk:5070 – Could not resolve proxy.cse.cuhk.edu.hk error 11001 shows that server does not exist. So clearly, one of our tests should have a bad/non-existant proxy set up.
The above are ways how logmine helps as a gateway to start finding errors and debugging it.
Conclusion
Explorers are constantly seeking new sources of information to make sense of the world they are in. Good exploratory testers are similar – they are constantly looking for new sources of information that can aid in their testing. I hope this article has armed you with a new tool to quickly get some information about the product you are testing.
Hire technical testers from Qxf2
Hiring technical testers from Qxf2 means getting testers who understand code, tools, and can adapt to your tech stack seamlessly. We bridge the gap between developers and QA, ensuring more efficient testing and better quality software. Get in touch with Qxf2 today!
My journey in software testing began with Calabash and Cucumber, where I delved into Mobile Automation using Ruby. As my career progressed, I gained experience working with a diverse range of technical tools. These include e-Discovery, Selenium, Python, Docker, 4G/5G testing, M-CORD, CI/CD implementation, Page Object Model framework, API testing, Testim, WATIR, MockLab, Postman, and Great Expectation. Recently, I’ve also ventured into learning Rust, expanding my skillset further. Additionally, I am a certified Scrum Master, bringing valuable agile expertise to projects.
On the personal front, I am a very curious person on any topic. According to Myers-Briggs Type Indicator, I am described as INFP-T. I like playing soccer, running and reading books.


[[..Pingback..]]
This article was curated as a part of #103rd Issue of Software Testing Notes Newsletter.
https://softwaretestingnotes.substack.com/p/issue-103-software-testing-notes
Web: https://softwaretestingnotes.com