In our previous blog post, I introduced the Streaming Data Generator, developed at Qxf2 and explored its capabilities in creating diverse data streams. Today, I want to delve into a specific and practical application – creating complex data streams by combining data from multiple endpoints. This method can help simulate real-world scenarios that are challenging to replicate with simple data streams alone.
In this blog post, I will show how to create complex or combined data streams with the help of a use case – “financial transaction monitoring”. By merging two different data streams, one that follows regular or cyclic pattern and another which has spikes, I can simulate transaction patterns with anomalies, providing a great tool for testing fraud detection systems. This technique enhances the realism of test data, offering deeper insights into system behavior under varied conditions.
Setting the Context
Let me construct a scenario for monitoring transaction volumes. Imagine I am a test engineer at an online retail store. This store has algorithms to handle various scenarios like high volumes of transactions during peak sale times, ensuring data integrity and privacy, and so on. Recently, a new feature has been added – detecting and responding to fraudulent transactions and alerting system has been developed to serve this purpose. To test this feature, using real transaction data isn’t practical or safe, so I turn to synthetic streaming data.
Let’s see how the Streaming Data Generator app can help here.
Setting Up the Synthetic Streaming Data
To create a realistic simulation of transaction volumes at the online retail store, I decide to combine two different types of data streams:
Normal Transaction Data: This represents the regular, everyday transactions that occur in the store. For this, I choose data that follows normal distribution to represent the natural rise and fall of transaction volumes throughout the day. And so, use the /normal endpoint of the application.
Anomalous Transaction Data: This includes unexpected spikes or drops in transactions that might indicate fraudulent activity. To mimic this behavior, I want to introduce clustered data points that are far away from regular data points thereby simulating behaviors such as multiple random transactions from a single account. For this, I use the /anomalous/clustered endpoint of the application.
With that in place, I will put up a Python script to merge these two data streams.
Collecting and Combining Data Streams
To combining data from multiple endpoints, I need to consume both streams simultaneously and merge their data points. Here’s my approach:
1. Consume Both Streams: Use separate threads for each stream to ensure they operate independently. This prevents blocking the main thread and facilitates concurrent data handling.
2. Combine Data Points: As the data points are collected from each stream, merge them to form the complex data stream. This involves adding corresponding data points from each stream to create a unified stream.
To get started, I use the consumer script from earlier blog post and enhance it to handle multiple streams and integrate them.
1. Consuming Data Streams
The consume_stream function connects to a data stream via a specified URL, using a bearer token for authentication. It continuously reads and decodes each line of data from the stream, placing data points into a queue for further processing.
def consume_stream(url, token, data_queue, timeout=10): """ Consumes a data stream from the given URL and puts each data point into a queue. Args: url (str): The URL of the data stream to consume. token (str): The bearer token for authentication. data_queue (Queue): The queue to put the data points into. timeout (int): The timeout for the requests.get call. """ headers = {"Authorization": f"Bearer {token}"} try: response = requests.get(url, headers=headers, stream=True, timeout=timeout) print(f"Connected to {url}") if response.status_code == 200: for line in response.iter_lines(): # filter out keep-alive new lines if line: data = line.decode('utf-8') data_queue.put(float(data)) else: print(f"Failed to connect, status code: {response.status_code}") print(response.text) except requests.exceptions.RequestException as error: print(f"Request failed: {error}") |
2. Combining Data Streams
The ‘combine_streams’ function accepts two queues, each containing data points from separate streams. It merges these data points to form a complex waveform by adding the values from both streams together and outputting the combined data.
def combine_streams(queue1, queue2): """ Combines data points from two queues to create a complex data stream. Args: queue1 (Queue): The queue for the first data stream. queue2 (Queue): The queue for the second data stream. """ while True: data1 = queue1.get() data2 = queue2.get() combined_value = data1 + data2 combined_data = { 'stream1_value': data1, 'stream2_value': data2, 'combined_value': combined_value } print(f"{combined_data}") |
Note: The combined data printed to console includes values from both streams for illustrative purposes.
3. Managing Threads
In the main section of the script, initiate and execute the processes for consuming and combining data streams. Using concurrent.futures.ThreadPoolExecutor, concurrently execute the consume_stream function for two distinct endpoints. Subsequently, launch a thread to merge the data from these streams.
if __name__ == "__main__": BASE_URL = 'http://datagen.pythonanywhere.com' ENDPOINT1 = '/normal' ENDPOINT2 = '/anomalies/clustered' TOKEN = '' stream_queue1 = Queue() stream_queue2 = Queue() with concurrent.futures.ThreadPoolExecutor() as executor: executor.submit(consume_stream, BASE_URL + ENDPOINT1, TOKEN, stream_queue1) executor.submit(consume_stream, BASE_URL + ENDPOINT2, TOKEN, stream_queue2) combine_thread = threading.Thread( target=combine_streams, args=(stream_queue1, stream_queue2), daemon=True ) combine_thread.start() combine_thread.join() |
The complete script can be found here.
The output of the script looks something like this:
Visualizing the Data
To visualize the data, I used the plot_streaming_data script from earlier blog post to plot the graph. And updated it to include the logic of complex data stream. The script can be found here.
The graph of the combined data stream looked like this:
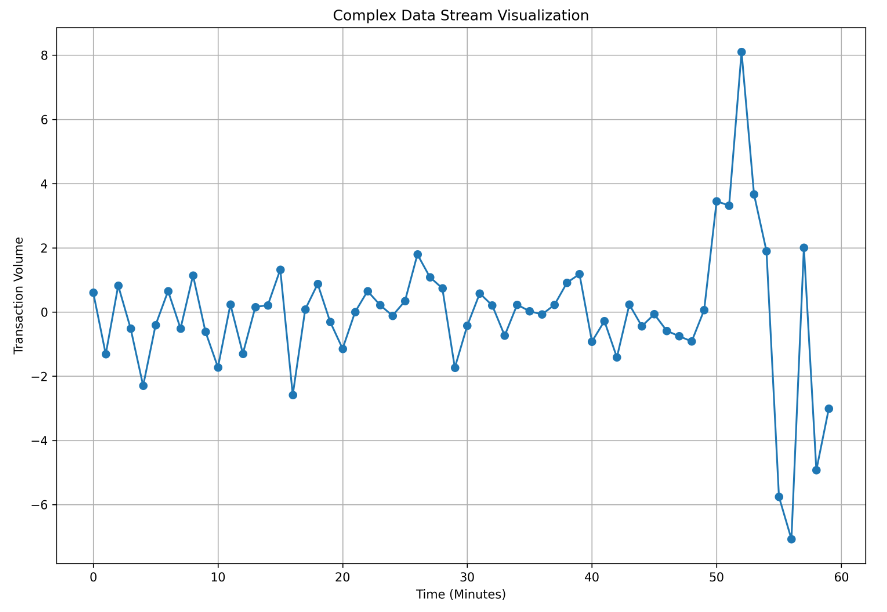
X-Axis: Represents time, with each data point corresponding to one minute of transaction data. It is plotted for 60 points representing a one hour duration.
Y-Axis: Represents the transaction volume, indicating the number of transactions processed in that minute.
Although this graph gives an overview, there are some issues that need to be addressed for more accurate representation. For instance,
* Negative Values: Some of the data points are negative, which doesn’t make sense for transaction volumes.
* Float Values: The data has floating-point numbers, but generally transaction counts should be whole numbers.
In the next section, I will show how to correct the data to suit our purposes.
Cleaning and Correcting the Data
To ensure the data better represents transaction volumes, it would be good to make some adjustments. Specifically, I would need to:
* Replace negative values with zero.
* Round the float values to the nearest whole number to ensure transaction counts are integers.
To implement these, I have modified the combine_streams function accordingly:
def combine_streams(queue1, queue2): """ Combines data points from two queues to create a complex data stream, ensuring non-negative integer values. Args: queue1 (Queue): The queue for the first data stream. queue2 (Queue): The queue for the second data stream. """ while True: data1 = queue1.get() data2 = queue2.get() combined_value = data1 + data2 combined_value = max(round(combined_value), 0) combined_data = { 'stream1_value': data1, 'stream2_value': data2, 'combined_value': combined_value } print(f"{combined_data}") |
The output of the updated script looks like this:
And the data when plotted is:
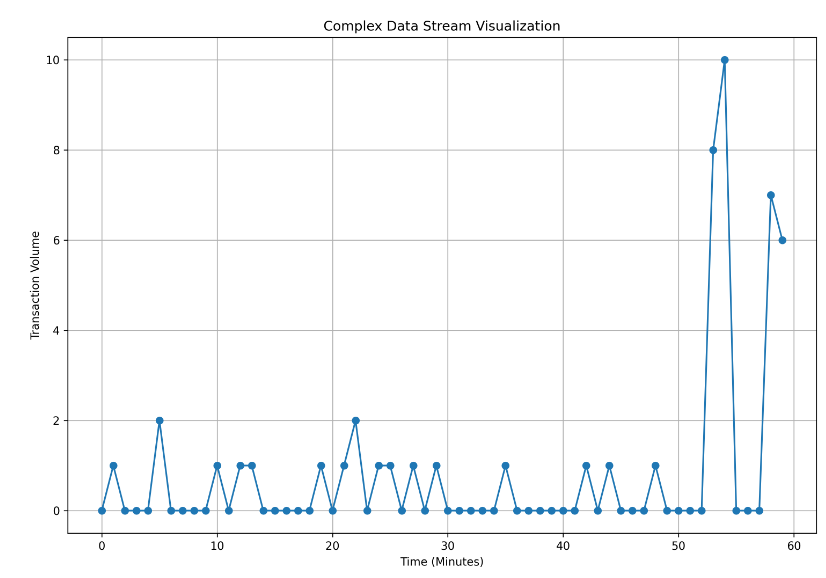
In the new data stream, most values are 0s with occasional 1s and 2s. This can be realistic if we consider the scenario of transaction volumes per minute in an online store, where transactions don’t happen every single minute.
However, I want to ensure that the data better reflects the typical activity of a busy online retailer. To do this, I decide to tweak the data transformation logic slightly.
Enhancing Data Further
Here, I introduce a scaling factor to amplify the transaction volumes. This adjustment will make the synthetic data stream more closely represent the real-world transaction patterns.
Again, I update the ‘combine_streams’ function further.
def combine_streams(queue1, queue2, scaling_factor=7): """ Combines data points from two queues to create a complex data stream, ensuring non-negative integer values and applying a scaling factor. Args: queue1 (Queue): The queue for the first data stream. queue2 (Queue): The queue for the second data stream. """ while True: data1 = queue1.get() data2 = queue2.get() combined_value = data1 + data2 combined_value = max(round(combined_value * scaling_factor), 0) combined_data = { 'stream1_value': data1, 'stream2_value': data2, 'combined_value': combined_value } print(f"{combined_data}") |
With this adjustment, the data stream produces outputs that better reflect realistic transaction volumes. The complete code snippet can be found here.
The output now looks like this:
And the graph is:
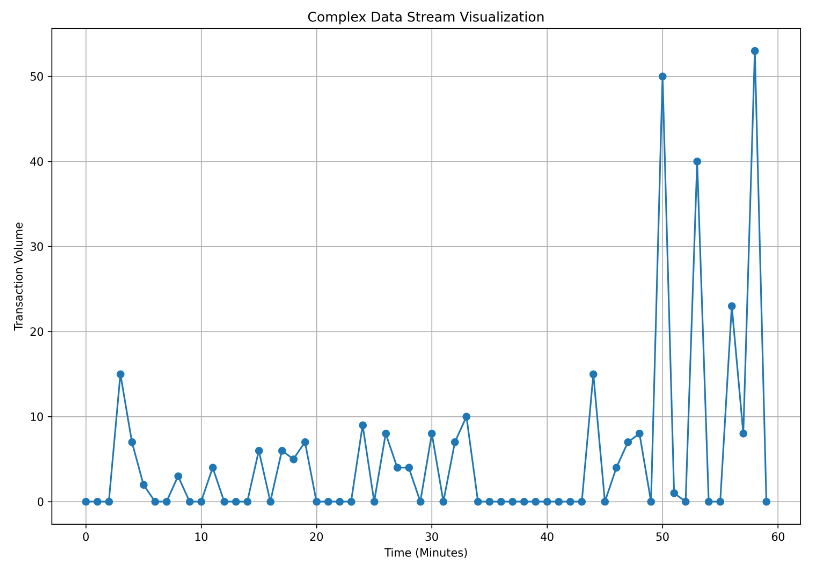
Analyzing the Enhanced Data
With the enhanced data stream, I now observe a more realistic pattern that aligns with the expected transaction volumes. The baseline data reflects the normal transaction flow, while occasional spikes in the graph suggest spikes that could indicate multiple rapid transactions or other unusual behavior. By closely examining these patterns, I can use it to test the alerting mechanism to ensure it effectively identifies and responds to fraudulent activities. Thus, using synthetic streaming data, I was able to simulate and test the new feature better with varied conditions.
Conclusion
In this blog post, we have explored how to create complex data streams by combining different data streams to simulate realistic transaction patterns. This approach provides a starting point for handling and analyzing complex data scenarios. By generating synthetic streaming data, you can simulate user behavior, test system scalability, and experiment with different data integration strategies. This flexibility allows for a broad range of testing scenarios, ensuring that your applications are robust and capable of handling diverse and dynamic real-world data.
When you are ready, here is how Qxf2 can help
QA engineers that know how to test well and are technical are as asset to any team. They bring in the right amount of scrutiny and testing to a project while collaborating smoothly with stakeholders and developers alike. Qxf2 is the home of such technical testers. Our services range from standard QA augmentation to developing specialized QA tools that make an entire team of testers more productive. If you are looking for senior QA engineers to help you with deeper technical testing problems, please reach out to us.
I have been in the IT industry from 9 years. I worked as a curriculum validation engineer at Oracle for the past 5 years validating various courses on products developed by them. Before Oracle, I worked at TCS as a Manual tester. I like testing – its diverse, challenging, and satisfying in the sense that we can help improve the quality of software and provide better user experience. I also wanted to try my hand at writing and got an opportunity at Qxf2 as a Content Writer before transitioning to a full time QA Engineer role. I love doing DIY crafts, reading books and spending time with my daughter.