Welcome to Qxf2’s Streaming Data Generator application! This tool makes it easy to generate and stream various kinds of synthetic data, helping with reproducible testing. Built with FastAPI, our app produces streaming data in different waveforms and distributions. It can also generate data with anomalies like random, random-square, clustered, etc. Access this data through HTTP endpoints, making it simple to use in your projects. The app can come handy for testing anomaly detection algorithms, performance testing of web services, conducting research and more. In this blog post, we will show you how to get started and use the app.
Note: This Streaming Data Generator app is currently in beta, offering flexibility for testing and customization. For higher loads, consider running the app locally. Visit our GitHub repository for instructions on setup and more details.
Why Use Synthetic Data?
Synthetic data is valuable in many professional contexts. It provides a controlled environment for testing, ensuring consistency and reproducibility. Plus, it mitigates privacy concerns since it doesn’t contain real user data, making it safe for sharing and testing. You can create custom scenarios, including rare or extreme events, for thorough validation. Additionally, synthetic data is always available and can be generated on demand, saving time and resources.
The Need for Synthetic Streaming Data
Streaming data offers crucial insights across various domains, enabling real-time monitoring and analysis that provide immediate feedback and actionable intelligence. Continuously capturing data allows organizations to detect trends, anomalies, and performance issues as they occur, facilitating proactive decision-making and enhancing operational efficiency. However, testing streaming data applications poses unique challenges, especially when it comes to simulating real-time events and replicating the complexities of live data streams, such as those used in stock market algorithms or event-based testing for fraud detection and IoT system management. Finding reliable sources for such data can be particularly challenging.
What our App offers
Our Streaming Data Generator app addresses such challenges by allowing you to simulate diverse data streams and complex scenarios effortlessly. It lets you create different data streams for testing, set up scenarios to mimic real-world conditions, and more. Here are a few key benefits:
Simulate Real-World Data: You can generate different data types, from waveforms to distributions. This capability helps you evaluate system performance across various data scenarios, ensuring robustness and reliability.
Automate Testing: You can easily integrate this tool into your automated testing frameworks. Set up the endpoints in your test scripts and use the data streams directly in your test cases.
Identify Anomalies: The app allows you to use anomalous data streams to test how well your systems detect and handle anomalies. This feature helps you improve and validate your anomaly detection algorithms with different types of anomalies like random, clustered etc.
Customizable Testing: You can adjust parameters to meet specific testing needs. This flexibility helps you conduct focused tests, giving you better insights into how systems behave and perform under controlled conditions.
Getting Started with the Streaming Data Generator application
Getting started with the Streaming Data Generator is straightforward. Here’s a quick guide to help you set up and begin using the application.
Step 1: Access the Application
Visit the Streaming Data Generator at http://datagen.pythonanywhere.com. The homepage provides detailed documentation about all available endpoints.
Step 2: Obtain a Bearer Token
To access the data streams, you need a valid bearer token. Follow these steps to register and obtain your token.
1. Register:
-
* Navigate to the registration section at http://datagen.pythonanywhere.com/#register-section.
* Enter your desired username and password, then submit.
2. Login and Generate Token:
-
* Login with the registered username and password.
* After successful login, copy the generated bearer token.
* Include the token in the Authorization header of your HTTP requests to access the streaming endpoints.
Alternatively, you can use curl commands to register and obtain the token:
curl -X POST http://datagen.pythonanywhere.com/register -H "Content-Type: application/json" -d '{"username": "youruser", "password": "yourpassword"}'
curl -X POST http://datagen.pythonanywhere.com/token -H "Content-Type: application/x-www-form-urlencoded" -d "username=youruser&password=yourpassword"
How to Use
To access a data stream, append the desired endpoint to the base URL. Here are some examples:
Sine Wave: http://datagen.pythonanywhere.com/sine
Random Anomalies: http://datagen.pythonanywhere.com/anomalies/random
Use the bearer token in the Authorization header for these requests.
Using Curl Commands
You can start streaming using a simple curl:
curl -X GET http://datagen.pythonanywhere.com/sine -H "Authorization: Bearer YOUR_TOKEN_HERE"
Using Python Scripts
We can consume streaming data using the Streaming Data Generator API using the requests library. In this section we will put up a small script that connects to a specified endpoint via HTTP and streams data to console.
Make sure you have the `requests` library installed.
pip install requests |
1. Consuming Data Streams
The consume_stream function connects to a data stream at a given URL. You provide the URL and a bearer token for authentication. Once connected, the function listens to the stream and prints each data point it receives. It does this by reading lines from the response and decoding them into a readable format. This is useful for real-time data monitoring, where you want to see data as it comes in.
def consume_stream(url, token): """ Consumes a data stream from the given URL and yields each data point. Args: url (str): The URL of the data stream to consume. token (str): The bearer token for authentication. Yields: str: The data point from the stream. """ headers = {"Authorization": f"Bearer {token}"} try: response = requests.get(url, headers=headers, stream=True, timeout=10) print(f"Connected to {url}") if response.status_code == 200: # Iterate over the response content line by line for line in response.iter_lines(): # filter out keep-alive new lines if line: # decode the byte string to a unicode string data = line.decode('utf-8') print(data) else: print(f"Failed to connect, status code: {response.status_code}") print(response.text) except requests.exceptions.RequestException as e: print(f"Request failed: {e}") |
Note: The script prints data to the console for the sake of this example. However, the data can be processed further based on specific application requirements. For instance, you could store it in a database, perform real-time analytics, or integrate it into another system for automated decision-making.
2. Example Usage
In the script’s main function, we initiate a connection to a specific data stream. Here, we’re accessing a sine wave data stream located at http://datagen.pythonanywhere.com/sine. Using a bearer token for authentication, we call the consume_stream function to start fetching and printing data points from the stream.
if __name__ == "__main__": BASE_URL = 'http://datagen.pythonanywhere.com/sine' TOKEN = 'your_bearer_token_here' consume_stream(BASE_URL, TOKEN) |
The complete code can be found here.
The script produces output like this run on a Linux machine:
Plotting and Visualization
To demonstrate how the data looks, we can plot it on a graph using a library like Matplotlib. Here’s a basic example showing how to fetch specific number of data points and plot them.
1. Collecting Data Points
The collect_data function connects to a specified data stream URL using a bearer token for authentication. It retrieves a specified number of data points from the stream, decoding each line of data and storing it in a list.
def collect_data(url, token, num_points): """ Collects a specified number of data points from the stream. Args: url (str): The URL of the data stream to consume. token (str): The bearer token for authentication. num_points (int): The number of data points to collect. Returns: list: A list of collected data points. """ data_points = [] headers = {"Authorization": f"Bearer {token}"} try: response = requests.get(url, headers=headers, stream=True, timeout=5) print(f"Connected to {url}") if response.status_code == 200: for i, line in enumerate(response.iter_lines()): if i >= num_points: break if line: decoded_line = line.decode('utf-8') print(decoded_line) data_points.append(float(decoded_line)) print(f"Collected {len(data_points)} data points.") else: print(f"Failed to connect, status code: {response.status_code}") print(response.text) except requests.exceptions.RequestException as e: print(f"Request failed: {e}") return data_points |
2. Plotting Data Points
The plot_data function plots the collected data points using Matplotlib. It creates a line plot where each data point’s value is plotted against its index.
def plot_data(data_points, title="Data Stream"): """ Plot the collected data points. Args: data_points (list): A list of data points to plot. title (str): The title of the plot. """ plt.figure(figsize=(12, 8)) plt.plot(data_points, marker='o', linestyle='-') plt.title(title) plt.xlabel("Data Point Index") plt.ylabel("Value") plt.grid(True) plt.savefig("data_plot.png", dpi=300) |
3. Example Usage
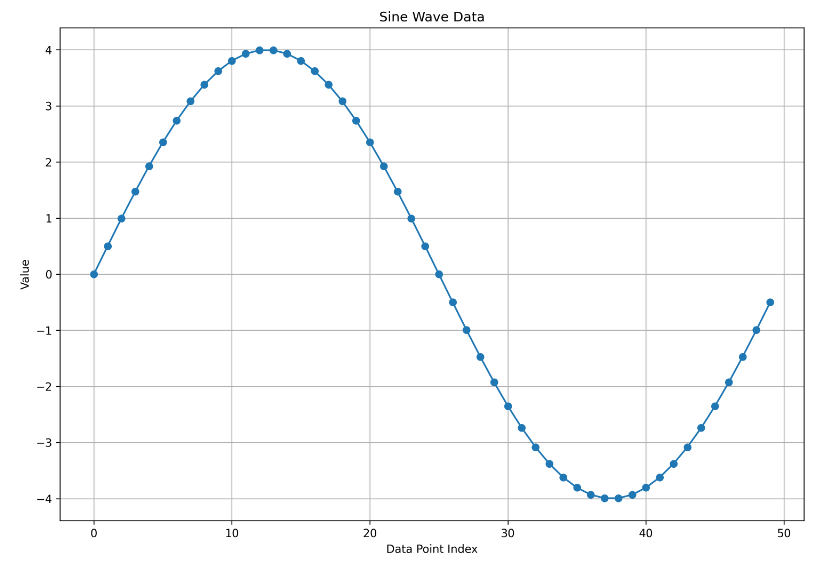
In the script’s main section, we connect to a sine wave data stream using a provided bearer token (‘your_bearer_token_here’). We then collect 50 data points from this stream using the collect_data function and proceed to plot these points as a sine wave graph using the plot_data function.
if __name__ == "__main__": BASE_URL = 'http://datagen.pythonanywhere.com/sine' TOKEN = 'your_bearer_token_here' NUM_POINTS = 50 sine_data_points = collect_data(BASE_URL, TOKEN, NUM_POINTS) plot_data(sine_data_points, title="Sine Wave Data") |
The complete code can be found here.
Below is a snapshot of the graph generated from the collected sine wave data using 50 data points for this example.
And here is an animated visualization of the data stream run interactively in a Jupyter notebook (for illustration purposes).
Customizing Data Streams with Parameters
The Streaming Data Generator allows you to customize the values of parameters for each data stream. By default, these parameters have preset values, but you can modify them to meet your specific needs. Below is a script demonstrating how to parameterize the data stream.
In this example, we adjust the ‘/anomalies/random’ data stream by increasing the ‘anomaly_probability’ to 0.2 (from the default 0.1) and setting the ‘data_interval’ to 0.2 seconds (from the default 0.1 seconds). Any parameters not explicitly provided will use their default values.
1. Creating URL with Query Parameters
The create_url function helps you build a complete URL with query parameters. First, you provide the base URL and the specific endpoint you want to access. If you have any query parameters, you can include them as keyword arguments. The function then turns these keyword arguments into a list of key-value pairs and joins them with ‘&’ to form the query string. Finally, it appends this query string to the URL, making it ready to use. This is really handy when you need to dynamically construct URLs for different API calls. To know more about the parameters that each endpoint accepts, check out the documentation – Endpoints section. Navigate to the Regular or Anomalous streams buttons for detailed information on each endpoint.
def create_url(base_url, endpoint, **params): """ Creates a URL with query parameters. Args: base_url (str): The base URL of the data stream. endpoint (str): The specific endpoint for the data stream. **params: Arbitrary keyword arguments representing the query parameters. Returns: str: The full URL with query parameters. """ url = f"{base_url}{endpoint}" if params: # Convert the keyword arguments into a list of key-value pairs query_pairs = [f"{key}={value}" for key, value in params.items()] # Join the key-value pairs with '&' to form the query string query_string = '&'.join(query_pairs) # Append the query string to the URL, preceded by '?' url = f"{url}?{query_string}" return url |
2. Example Usage
In the script’s main function, we set up the URL and parameters for the data stream. We use the create_url function to build the full URL, including query parameters like anomaly_probability and data_interval. With the full URL and a bearer token, we call consume_stream to connect to the data stream and start printing data points.
if __name__ == "__main__": BASE_URL = 'http://datagen.pythonanywhere.com' ENDPOINT = '/anomalies/random' PARAMS = { 'anomaly_probability': 0.2, 'data_interval': 2 } TOKEN = 'your_bearer_token_here' full_url = create_url(BASE_URL, ENDPOINT, **PARAMS) consume_stream(full_url, TOKEN) |
The complete code can be found here.
The output of the script looks something like this (run on a Linux machine):
As demonstrated through these scripts, you can effectively connect to data streams and use the data. These methods provide a straightforward approach to working with streaming data, though there are various other approaches available depending on specific needs and technologies.
Examples of Real-World Scenarios of Streaming Data
This section explores a few practical examples where the Streaming Data application can be useful.
1. Testing Anomaly Detection Algorithms
Scenario: Developing an anomaly detection system for monitoring network traffic or financial transactions.
Use Case: Use the anomalous data streams from the Streaming Data Generator to validate your anomaly detection algorithms. Inject controlled anomalies like periodic spikes or random outliers into data streams to see if your system accurately identifies and handles these irregularities.
Example: Combine the /sine endpoint with /anomalies/periodic-spike to simulate data with periodic spikes and evaluate your system’s detection capabilities.
2. Fraud Detection
Scenario: Developing a fraud detection system for financial transactions.
Use Case: Use the Streaming Data Generator to simulate transaction data with potential fraudulent activity. This allows you to test your fraud detection algorithms under various conditions and refine them to reduce false positives and improve accuracy.
Example: Combine the /normal endpoint with /anomalies/random-square to simulate normal transaction data with occasional fraudulent transactions.
3. Verifying Data Visualization Tools
Scenario: Building a dashboard to visualize real-time data for end-users.
Use Case: Stream different waveforms and distributions to your data visualization tool to validate real-time data rendering accuracy.
Example: Use sine and cosine wave data streams to visualize cyclical patterns and confirm the precision of your data visualization components.
4. Testing Alerting Systems
Scenario: Maintaining an alerting system for monitoring critical infrastructure.
Use Case: Generate data with specific anomalies to rigorously test alerting thresholds and response mechanisms. Create abnormal scenarios to improve alert accuracy, reduce false alarms, and ensure timely notifications.
Example: Utilize the /anomalies/clustered endpoint to create scenarios with clustered anomalies and validate the responsiveness of your alerting system.
What’s Next?
To sum up, the Streaming Data Generator app facilitates real-time data streaming which can be useful for a variety of applications. Its ability to generate diverse data streams and simulate anomalies makes it a great tool for testing, developing, and validating complex systems. Look forward to our next blog, where we will explore a real-world scenario in detail.
When you are ready, here is how Qxf2 can help
Qxf2 is the home of technical testers. We describe our brand as technical testing. Over the last several years, we have worked on many challenging technical projects, introducing several testing techniques and tools that go well beyond regular test automation. We have also had the discipline to share these techniques and tools with the larger testing community. If you are looking for technical testers to join your project, please reach out to us.
I have been in the IT industry from 9 years. I worked as a curriculum validation engineer at Oracle for the past 5 years validating various courses on products developed by them. Before Oracle, I worked at TCS as a Manual tester. I like testing – its diverse, challenging, and satisfying in the sense that we can help improve the quality of software and provide better user experience. I also wanted to try my hand at writing and got an opportunity at Qxf2 as a Content Writer before transitioning to a full time QA Engineer role. I love doing DIY crafts, reading books and spending time with my daughter.